
Following futures positions of non-commercials are as of February 13, 2018.
10-year note: Currently net short 296.9k, down 30.6k.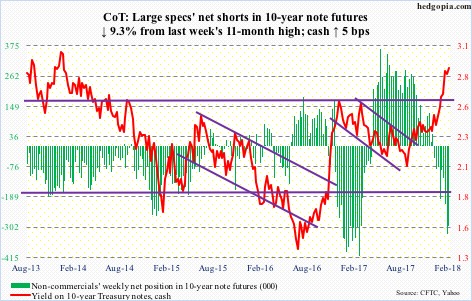
If 10-year Treasury yields (2.88 percent) reach three percent – or even where they are currently – would/could that be used as an opportunity to go long bonds? Possibly – at least near term. In fact, they did tag 2.93 percent Thursday before coming under slight pressure.
Yields have come a long way in a short span of time. As early as September 7 last year, they were 2.03 percent. Not surprisingly, on nearly all timeframe, they have entered – or soon will – overbought territory. On the weekly chart, there have been back-to-back long-legged dojis.
The level to watch on the way down is 2.62 percent, which also represents the neckline of a reverse-head-and-shoulders pattern. Yields broke out of that resistance-turned-support a month ago. If it is a genuine breakout, in due course they could be headed toward 3.9 percent. Hence the significance of how bond vigilantes act around that level.
30-year bond: Currently net long 3.8k, down 19.3k.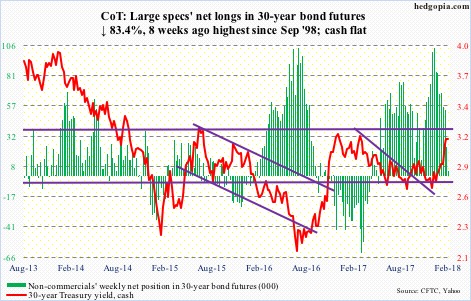
Major economic releases next week are as follows. Monday is a holiday. Happy Presidents Day!
Wednesday brings existing home sales for January. December sales fell 3.6 percent month-over-month to a seasonally adjusted annual rate of 5.57 million units. November’s 5.78 million was the highest since 5.79 million in February 2007.
FOMC minutes for the January 30-31 meeting are published the same day. Markets would be most interested in learning what members thought of core consumer inflation that has been creeping higher in recent months but still under the two percent goal and if they thought they needed to nip it in the bud.
Crude oil: Currently net long 782.2k, down 8.5k.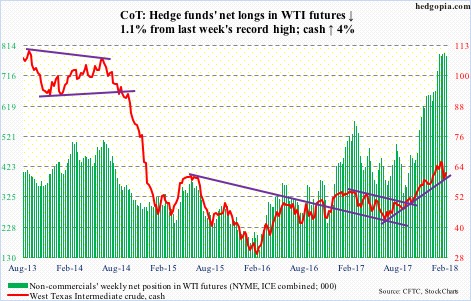
U.S. crude production continued to inch higher, up 20,000 barrels per day to 10.3 million b/d. This was for the week ended February 9.
The EIA report – out Wednesday – also showed that crude stocks rose 1.8 million barrels to 422.1 million barrels. Gasoline stocks also increased – up 3.6 million barrels to 249.1 million barrels.
Refinery utilization declined 2.7 percentage points to 89.8 percent.
Distillate stocks, however, fell – down 459,000 barrels to 141.4 million barrels. As did crude imports, which dropped 4,000 b/d to 7.9 mb/d.
Spot West Texas Intermediate crude ($61.55/barrel) reacted to the report by rallying off support at $58-59. From the high of $66.66 on January 25, the crude had already dropped about 13 percent, and was oversold. Friday, it nudged past the 50-day moving average ($61.30). Resistance is stiff at $63.
E-mini S&P 500: Currently net long 179k, down 107.2k.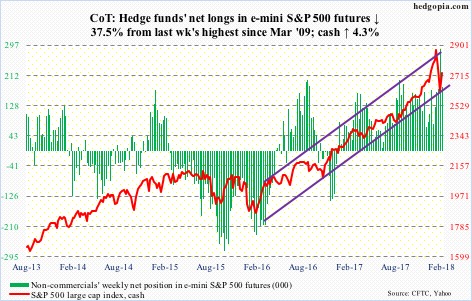
Intraday between the all-time high of 2872.87 on January 26 and the reversal low of 2532.69 on February 9, the cash (2732.22) shed 11.8 percent. A 61.8-percent Fibonacci retracement of this decline lies at 2743. This is an area worth watching. Friday, the S&P 500 rallied to 2754.42 intraday, but only to give back those gains to produce a shooting star by close. This is potentially bearish. Early next week would be crucial.
The index is just above the 50-day. After that reversal six sessions ago, it massively rallied.
From a low of 13.6 percent on February 8, the percent of S&P 500 stocks above 50-day quickly rose to 48 percent. In the right circumstances, there is room for it to continue higher. Provided, of course, flows improve.
In the week ended Wednesday, U.S.-based equity funds (including ETFs) lost another $4.6 billion – an improvement from withdrawal of $23.9 billion in the prior week, but still an outflow (courtesy of Lipper).
In the same week, per ETF.com, $759 million moved into VOO (Vanguard S&P 500 ETF) and $567 million into IVV (iShares core S&P 500 ETF), but this was not sufficient to offset the loss of $4 billion out of SPY (SPDR S&P 500 ETF).
It will be interesting to find out how foreigners reacted to the recent sell-off, but we will have to wait a while for that data. We just got December’s numbers. Last year, they net-purchased $126.5 billion in U.S. stocks. On a 12-month rolling total basis, back in February 2016, when stocks in general reached a major bottom, they sold record $145.3 billion worth, before reversing.
Euro: Currently net long 127.3k, down 13.5k.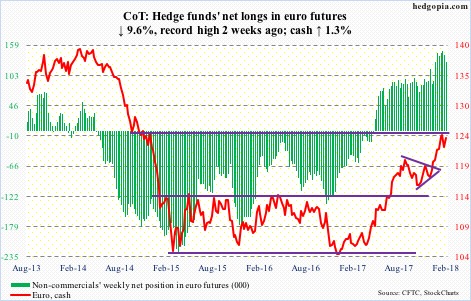
Euro bulls were not willing to give up $122. Support at $120-121 was not even tested on the cash ($124.05). Rather, they once again hammered on resistance at $125 (rallied to $125.11 intraday Thursday).
Three weeks ago on January 25, the euro retreated after hitting $125.37. A falling trend line from the all-time high of $160.20 in April 2008 lies there. This level also represents measured-move-target resistance of a 10-point range breakout last July. Hence its significance. Needless to say, a breakout would be massive, but looks unlikely at least near term. Non-commercials’ massive net longs continue to pose a risk should they start unwinding.
Gold: Currently net long 175.6k, down 15.3k.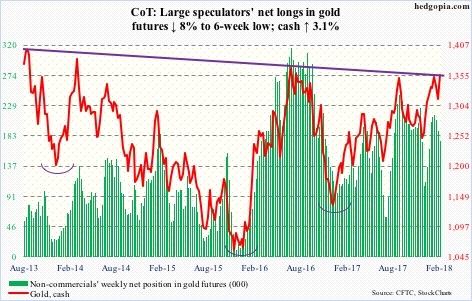
Last week, the cash ($1,356.20/ounce) just about tested crucial support at $1,300, dropping to $1,309 on February 8. This was preceded by a drop after peaking at $1,365.40 on January 25. This was an important level.
Back then, the metal got rejected at a slightly falling trend line from August 2013. Friday, it literally closed on it. This level also approximates the neckline of a reverse-head-and-shoulders formation. Then there is Fibonacci resistance. Gold peaked in September 2011 at $1,923.70, then bottoming at $1,045.40 in December 2015. A 38.2-percent retracement of this decline lies at $1,380.91.
This week’s rally was helped by a lower dollar, as likely did the higher-than-expected CPI print. Flows, however, were a negative.
In the week through Wednesday, IAU (iShares gold trust) saw no activity, while GLD (SPDR gold ETF) lost $136 million (courtesy of ETF.com).
That said, it is not too surprising for gold – or any other asset, for that matter – to hesitate and witness a back-and-forth around the kind of resistance it finds itself facing currently.
The benefit of the doubt remains with the bulls, unless $1,300 is lost.
Nasdaq 100 index (mini): Currently net short 10.4k, down 22.9k.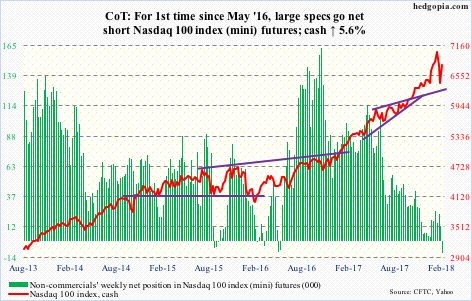
Bulls recaptured the 50-day in no time.
On the surface, QQQ (PowerShares QQQ ETF) in the week through Wednesday lost $2.5 billion, but this belies the fact that this was mainly due to $3.4 billion that was withdrawn last Thursday and Friday. In the first three sessions this week, $917 million came in (courtesy of ETF.com).
With that said, from the reversal low of last Friday to the intraday high this Friday, the cash (6770.66) rallied 11 percent. Things could rest a little.
Friday produced a potentially bearish shooting star. Non-commercials used the rally as an opportunity to go net short.
Russell 2000 mini-index: Currently net short 8.3k, down 21.9k.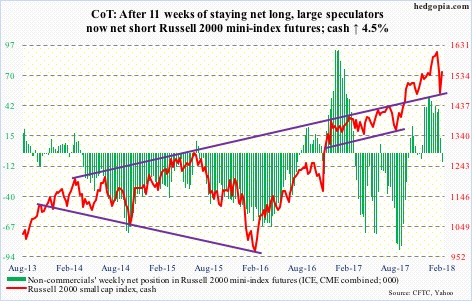
Small-caps continue to send out ‘caution’ vibes.
Of major U.S. indices, the cash (1543.55) was the first to lose the 200-day during the recent sell-off, and is yet to win back the 50-day. Friday, it closed just underneath.
Giving kudos where kudos is due, the bulls did recapture four-month resistance at 1515, which was then defended intraday Thursday.
In the week to Wednesday, IWM (iShares Russell 2000 ETF) attracted $995 million, and IJR (iShares core S&P small-cap ETF) $94 million (courtesy of ETF.com).
Longer-term, looking at the monthly chart, it looks as though the Russell 2000 is in the process of topping out.
US Dollar Index: Currently net short 2.9k, down 725.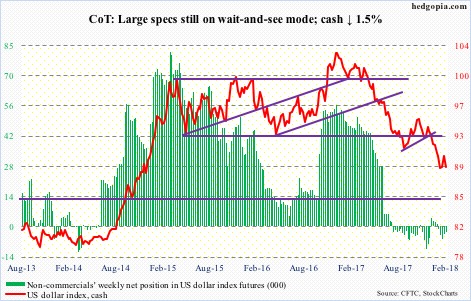
Short-term resistance at 90.50 on the cash (89.01) proved tough. This was tested – unsuccessfully – on February 8, and the decline since once again tested crucial support at 88-89, which goes back to early 2004. The intraday low of 88.15 Friday – slightly undercutting 88.25 on January 25 – also tested a rising trend line from May 2011.
All this is taking place amidst a big jump in U.S. interest rates! A loss of the afore-mentioned support makes the dollar index vulnerable to a test of 84-85.
VIX: Currently net long 74.6k, down 11.3k.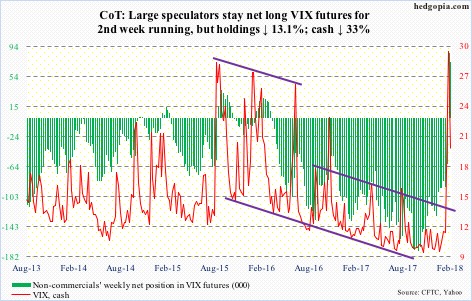
From an intraday low of 12.50 on February 1 to 50.30 three trading sessions later (6th) to back down to a low of 17.44 Friday, the cash (19.46) has had its share of volatility – to say the least.
VXX (iPath S&P 500 VIX short-term futures ETN) lost $488 million in the week to Wednesday (courtesy of ETF.com).
Despite the recent surge and the reversal since, VIX has merely gotten back to its long-term average. Going back to January 1990, the daily average lies at 19.35. That is how suppressed volatility remained for a very long time.
The question is, has VIX now entered a new – and higher – regime?
It is worth recalling that non-commercials last week switched to most net long ever. This week, their holdings fell some, but are still elevated. If past is prologue, this gradually gets unwound, pushing the cash lower.
We will begin to witness some change in this phenomenon if indeed there has been a change in VIX’s character. Volatility bulls need to defend support at 15-16 for this to pan out.
Thanks for reading!
