
The S&P 500 index was one of the major US indices to rise to new highs yesterday. The broader market, as represented by the Value Line geometric index, is not taking part in this.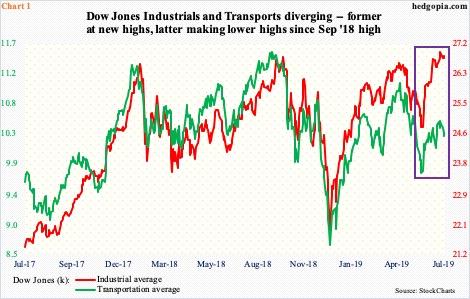
In US markets – or any other markets, for that matter – rarely do all stars line up in a perfect symmetry. Divergences are commonplace. Yet, some divergences are more important than others. Just the nature of things!
Wednesday, the S&P 500 large cap index (2993.07), Nasdaq composite (8202.53) and Dow industrials (26860.20) all rallied to new intraday highs – 3002.98, 8228.60 and 26983.45, respectively. Yet, beneath this record-setting run lie divergences that cannot be brushed off as if it was nothing.
Take Chart 1, which pits the Dow industrials with the Dow transports. In theory, what the former produces gets transported by the latter, hence the need for both to move hand in hand. Most of the time, they do exactly that. But there are exceptions, which is the case currently.
The Transports peaked last September, which the three other indices above did as well. But the other three have gone on to exceed those highs. The Transports, on the other hand, have gone on to post lower highs. Something is not quite right. Either the Industrials are lying or the Transports.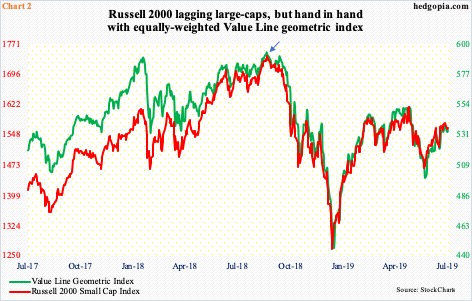
As things stand, action is in large-caps. Small-caps are missing in action. The Russell 2000 small cap index peaked as early as last August, with persistent lower highs since. Broad market participation is lacking.
This fact is also reflected in the Value Line geometric index, which is an equally-weighted index. In contrast, the S&P 500 is market cap-weighted; bigger companies will have disproportionate influence on how the S&P 500 performs. This is probably why the Value Line geometric index is moving in tandem with the Russell 2000, with the former peaking last August as well (arrow in Chart 2).
Besides the fact that small-caps, transports and the broader market as represented by the Value Line geometric index are lagging, the more pertinent question is, why are they lagging? This is not some recent phenomenon. It has gone on for weeks, even months. The investing environment is not completely risk-on, as is evident in how small-caps are behaving, but those that bet on the S&P 500 are sitting pretty. Despite this, the fact remains that crucial sectors are massively lagging behind. This cannot be healthy from a medium- to long-term perspective.
Thanks for reading!
