
The post-Great Recession recovery has been uneven. Jobs have been one of the bright spots. In the dying months of last year, job openings – both non-farm and small-business – weakened. It is too early to declare a trend has begun. If it has, the Fed’s conventional toolbox is hardly full. The Fed funds rate is already at a range of 150 to 175 basis points, down 75 basis points last year. Historically, a sustained drop in the policy rate coincides with both recession and peak in stocks.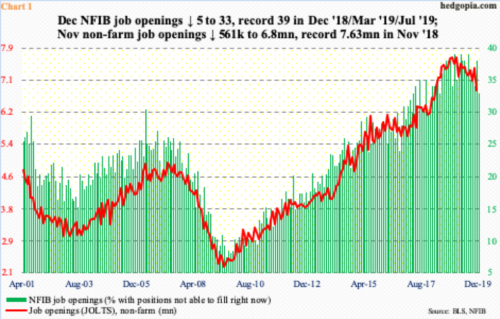
Last November, US non-farm job openings dropped big, down 561,000 to 6.8 million from the prior month. This was a 21-month low. The all-time high of 7.63 million was recorded in November 2018.
A month after that, in December 2019, the NFIB job openings sub index dropped five points month-over-month to 33, matching May 2018’s reading. Beginning December 2018, record high 39 was hit three times before the metric weakened last month (Chart 1).
Post-Great Recession, the recovery/expansion has been uneven, with jobs one of the bright spots, so any potential weakness on this front is worth watching.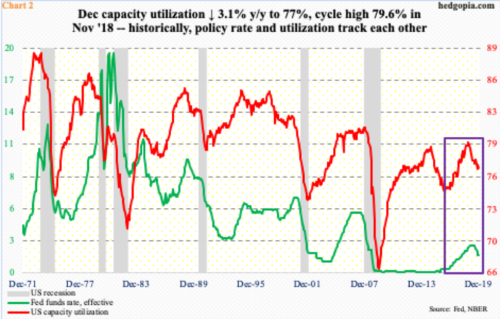
Several other metrics are weak and have been that way for a while now.
Capacity utilization continues to languish. In the 12 months to December, it declined 3.1 percent to 77 percent. Last October’s 76.9 percent was a 25-month low. The cycle high 79.6 percent never crossed 80 percent, which is a rarity in itself (Chart 2).
Subdued capacity utilization was one of the excuses the Fed needed to ease last year. The fed funds rate was reduced by 75 basis points in three 25-basis-point increments, to a range of 150 to 175 basis points. Rates are already so low that in the event the economy genuinely weakens, the Fed has very little it can do in the way of traditional tools such as its benchmark rate.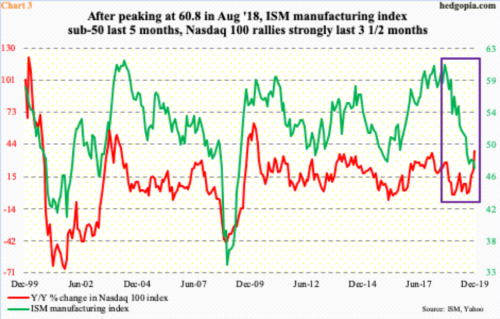
Manufacturing has been in contraction the last five months. In December, the ISM manufacturing index dropped 0.9 points m/m to 47.2 – the lowest since June 2009. Activity has weakened since peaking at 60.8 in August 2018. December’s was a fifth month in a row of sub-50 reading.
Historically, stocks move in tandem with how manufacturing fares. This time around, the two have diverged. The red line in Chart 3 represents the year-over-year percent change in the Nasdaq 100 index. Since bottoming last August, it has gone vertical, the last three months in particular.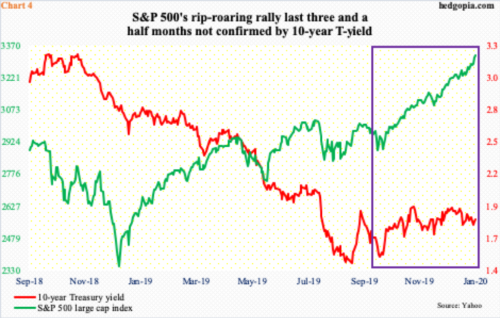
Stocks have also diverged with the bond market. The S&P 500 large cap index bottomed early October, before rallying in excess of 16 percent. Right around that time – on October 8 to be exact – the 10-year Treasury yield bottomed at 1.51 percent, closing last week at 1.84 percent. Rates remain under resistance at two percent. A month after that October bottom, the 10-year retreated from 1.97 percent. Then again, on Christmas Eve, a ceiling was hit at 1.95 percent.
In other words, for over three months now the S&P 500 has gone straight up, even as the 10-year yield is slightly up to sideways (Chart 4). If stocks are rallying in anticipation of better macro news, the bond market is not buying it.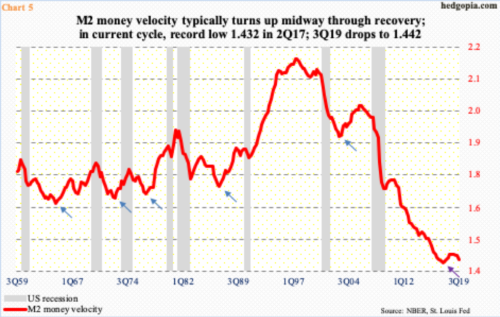
With that said, this has also been a cycle where lots of traditional relationships have broken down.
Traditionally, the M2 money velocity has shown a tendency of turning up midway through the cycle (blue arrows in Chart 5). The current cycle is five months short of completing 11 years, and velocity is yet to firm up. In fact, 2Q17 posted a record low of 1.432. It then rose to 1.462 in the last two quarters of 2018, before coming under renewed pressure the next three quarters; 4Q19 came in at 1.442.
The Fed is doing all it can not to let the economy slip into recession. In so doing, it is also doggedly denying the business cycle a chance to self-correct. This expansion has already lasted a decade. Excesses naturally have built up, but there are no purges. This has given investors, among others, a false assurance that it is all good and that nothing can go wrong.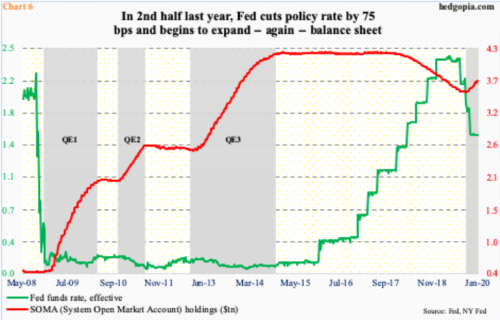
As explained earlier, the Fed last year reduced its benchmark rate by 75 basis points. Then, beginning early October, it began to add to its balance sheet. SOMA (System Open Market Account) holdings went from $3.55 trillion late September to $3.74 trillion last week (Chart 6).
Earlier, in the wake of the 2008-2009 financial crisis, SOMA holdings went from under $500 billion pre-crisis to $4.24 trillion in April 2007. The planned reduction of the bloated balance sheet since that high has stopped – in apparent response to money-market stresses that were building last September.
Coincidence or not, US stocks bottomed early October.
Further, markets seem to be leaning toward one more cut this year. In the futures market, December odds of a 25-basis-point cut are just over 50 percent. If it comes to pass, this will have brought the fed funds rate to a range of 125 to 150 basis points.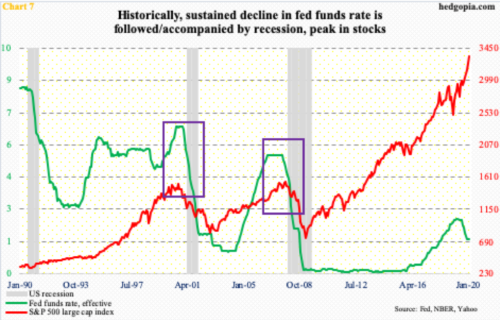
Markets are liking the idea of the possibility of one more rate cut, not to mention the ongoing expansion in the Fed’s balance sheet. For all that, too much of a good thing is not always good.
Fully aware that several historically tight relationships have broken down in the current cycle, Chart 7 shows an interesting relationship between the policy rate and US recession/stocks. At least in the prior two cycles, a sustained drop in the fed funds rate is followed or accompanied by both contraction in the economy and peak in stocks. Equity bulls are betting on a breakdown in this relationship. Time will tell.
Thanks for reading!
