
Amid interesting developments relating to a couple of dividend metrics, the S&P 500 quickly shed 5.3 percent from high to low this month and is just underneath crucial support-turned resistance.
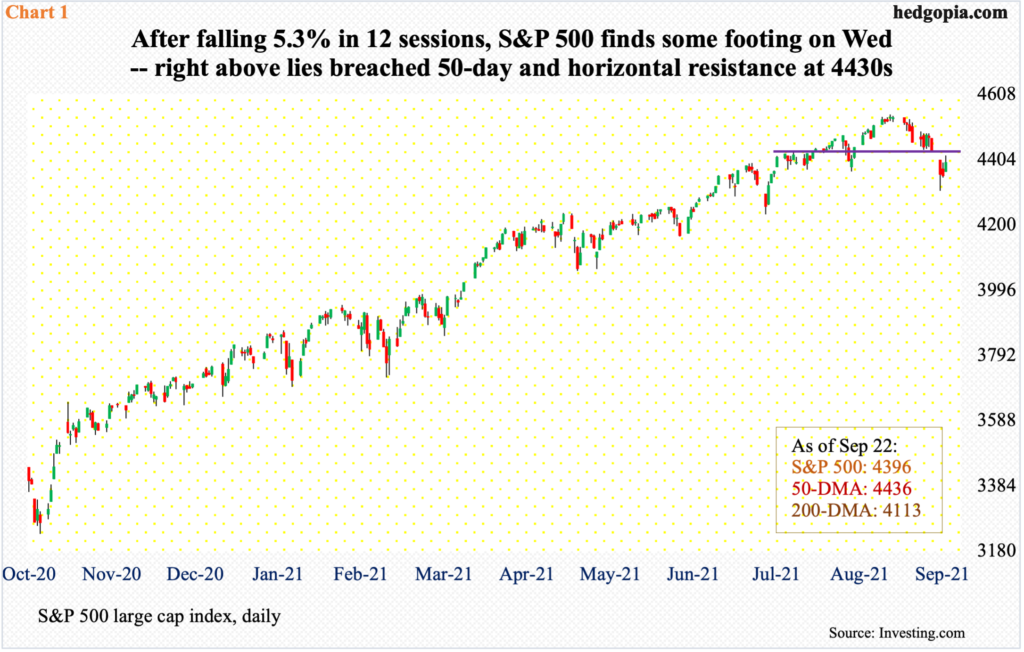
The S&P 500 quickly shed 5.3 percent in 12 sessions, having peaked on the 2nd at 4546 and bottomed at 4306 on the 20th.
In the process, the large cap index lost the 50-day (chart here). From May last year, this was the 11th test of the average. The prior 10 were successful.
In September and October last year, the S&P 500 remained under the average for several sessions before reclaiming it. How things transpire in the sessions ahead is crucial. On Wednesday, the index rallied just under one percent to close at 4396 but was unable to hang on to all of the gains, leaving behind a large upper shadow.
The 50-day lies right above at 4436, which lines up with broken horizontal support (Chart 1).
The latest action comes after a 107-percent jump from a major bottom in March last year. Longs are sitting on tons of paper gains. How this selloff evolves could very well tempt them to lock in at least some of the profit. On the other hand, it could easily turn into one of the several buy-the-dip moments. The sooner equity bulls reclaim the 50 day the better.
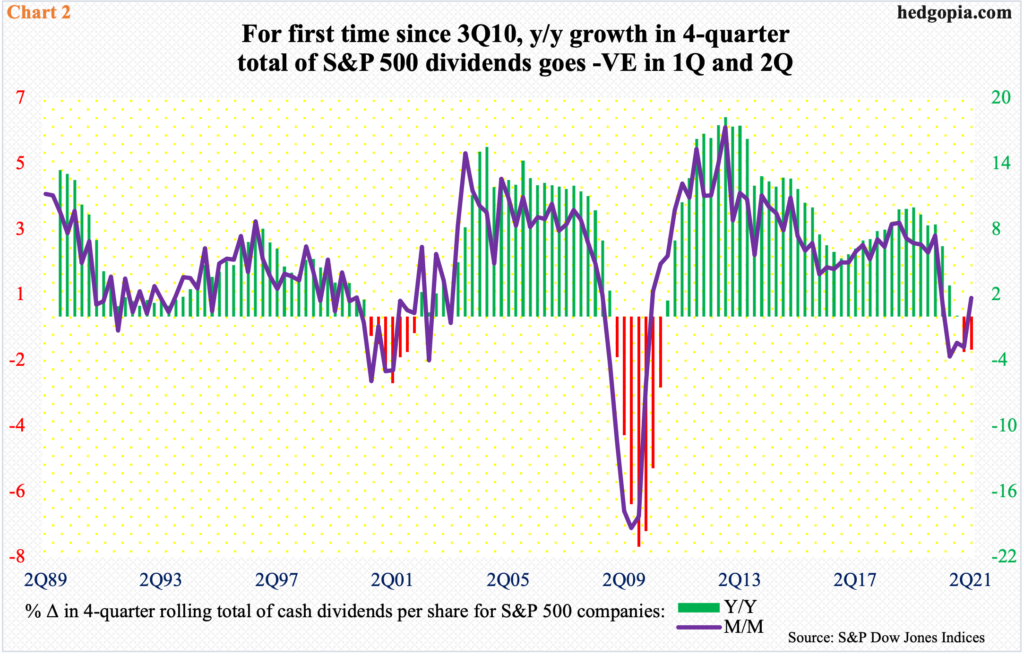
In the meantime, for the first time since 3Q10, the four-quarter rolling total of dividends for S&P 500 companies declined year-over-year in 1Q and 2Q this year (Chart 2).
Back then, dividend growth turned negative y/y in 1Q09, and the trend lasted through 3Q10. The S&P 500 peaked in October 2007 and bottomed in March 2009 – meaning the index bottomed in the same quarter as dividend growth turned negative.
Earlier in 2000, the four-quarter total declined y/y in 3Q and remained in the red until 1Q02. The S&P 500 peaked in March 2000 and bottomed in October 2002. Unlike in 2009/2010, stocks followed the contraction in dividends much closer.
So, it is difficult to make out what the y/y decline in the first two quarters this year might imply. Bulls hope it does not follow the 2000-2002 playbook.
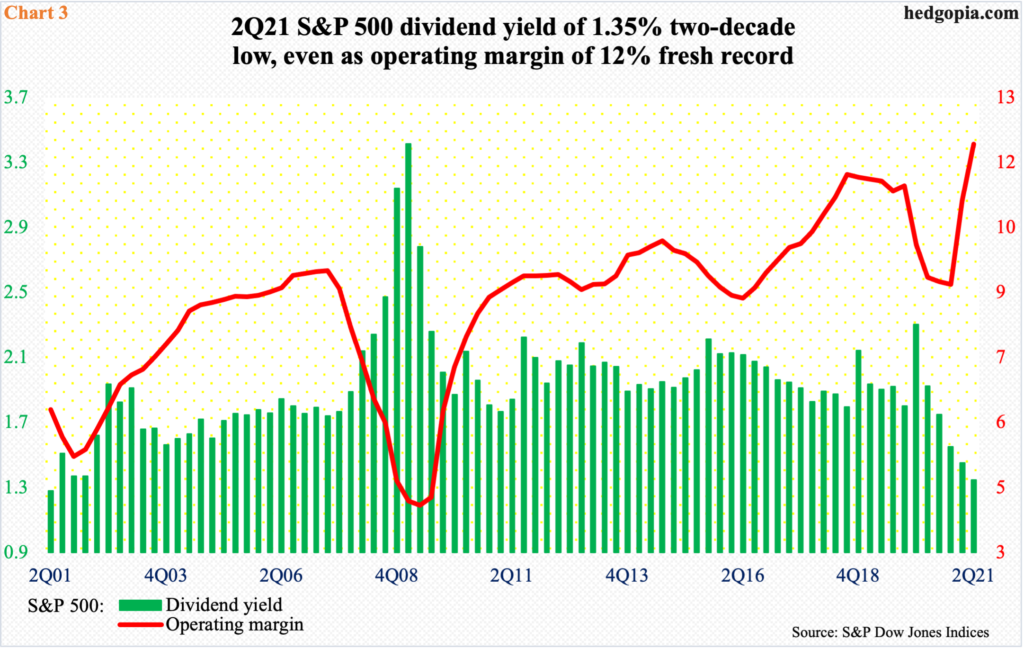
Margins continue to side with the bulls, but they are having to deal with a headwind coming from another metric.
In 2Q this year, S&P 500 dividends dropped $0.10 quarter-over-quarter to $14.58. The 1Q total of $14.68 was a record. On a four-quarter basis, 2Q dividends rose $0.23 q/q to $57.87 but dropped $1.81 from a year ago. The 2Q20 total of $59.68 was a record.
Combined with record high stock prices, this has put the dividend yield under consistent pressure. In 2Q this year, it was 1.35 percent (Chart 3) – a two-decade low and just about on par with the 10-year treasury yield.
This is potentially a headwind. Thus the significance of how the S&P 500 is trading so far this month and how it will trade in the sessions ahead.
Thanks for reading!
