
The 10-year Treasury rate has broken out. In less than two months, it has jumped 44 basis points. Equities are selling off. But how sustainable is the rise in these yields, given the leverage in the system?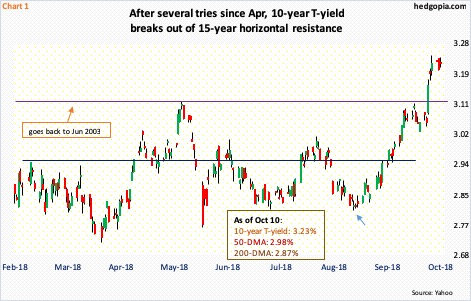
Chart 1 is causing a lot of stir and anxiety among equity investors. Or, they were simply looking for an excuse to sell off, and found one in the recent surge in rates.
The 10-year yield (3.23 percent) bottomed in July 2016 at 1.34 percent, and has since been making higher lows. In September last year, these notes were yielding 2.03 percent. Most recently, yields were 2.81 percent on August 22, then rising to 3.25 percent by last Friday. That is a jump of 44 basis points in less than two months.
Wednesday last week, the 10-year rate broke past the mid-May high of 3.12 percent. This resistance goes back to at least June 2003. The last time the 10-year unsuccessfully tried to take out three-plus percent was five years ago. Then in April this year, it again went after that ceiling, which finally gave way six sessions ago.
Arguably, this now opens up room for yields to head much higher. At least this sentiment is driving action in stocks, which are getting pummeled.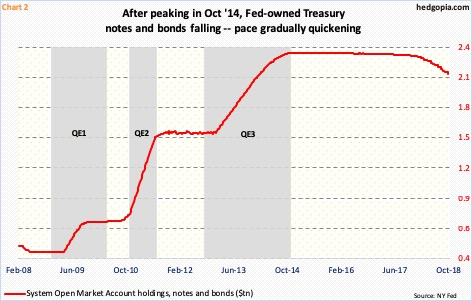
Fundamentally, there is a lot to argue for higher rates.
The Fed, for one, is cutting back on its Treasury holdings. Post-financial crisis, it began purchasing Treasury and mortgage-backed securities. During three iterations of quantitative easing, holdings of notes and bonds went from just north of $400 million in November 2008 to $2.35 trillion in October 2014. As of last week, this was down to $2.14 trillion (Chart 2). Beginning this month, reduction of these notes and bonds can be as high as $50 billion/month. This can begin to matter.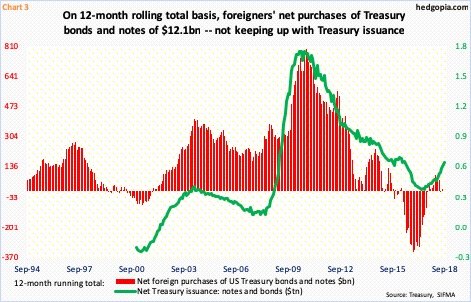
Foreigners of late have turned lukewarm toward US sovereign bonds. On a 12-month rolling total basis, they purchased $12.1 billion worth of Treasury bonds and notes in July. This dropped from purchases of $92.2 billion as recently as February.
Historically, foreigners’ purchases tend to follow issuance of Treasury securities (Chart 2). This time around, there has been a slight divergence.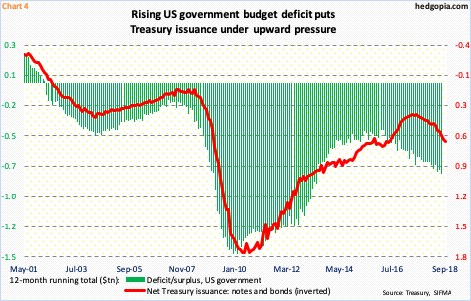
In September, on a 12-month rolling total basis, the Treasury issued $602 billion in notes and bonds. Issuance has persistently risen from $335 billion in July last year. The red line in Chart 4 potentially is headed a lot higher in the quarters/years to come, as it tracks the green bars, which represent the US government’s budget situation.
Once again, on a 12-month running total basis, the deficit in July totaled $783.8 billion. In January 2016, this was $403.6 billion. The persistent rise in the red ink has come at a time when the economy is in its 10th year of expansion. In all probability, last December’s tax cuts and the subsequent boost in fiscal spending will in due course worsen the budget situation.
All these factors potentially put upward pressure on yields. The question is, how high can they go?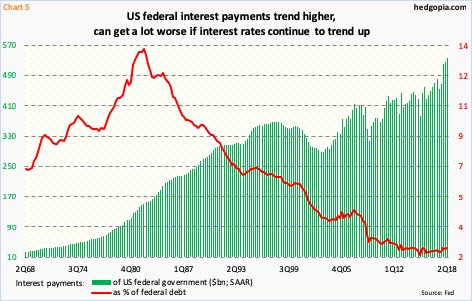
This is where leverage comes in. Post-financial crisis, leverage in the system has only grown. Let us take federal debt. When Great Recession ended in 2Q09, it was $11.5 trillion. Nine years later in 2Q18, this had ballooned to $21.2 trillion. In the same quarter, the government paid $537.8 billion in interest payments (seasonally adjusted annual rate) – a new high. Over the years, directionally, the green bars in Chart 5 have persistently gone from the lower left to the upper right. Despite the uptrend in the green bars, the red line has headed south since the early ’80s, as interest rates peaked.
In 2Q18, as a percent of debt, federal interest payments made up 2.54 percent. This effectively is the interest rate the government is paying. If the multi-decade bull market in bonds has ended, the red line gradually reverses higher. As explained earlier, the 10-year yielded 2.03 percent in September last year. It is up more than 100 basis points since. Assuming the 2Q18 effective interest rate was 100 basis points higher – that is, 3.54 percent – interest payments would amount to north of $750 billion. This is more than $210 billion the government actually paid. No chump change! Add to this corporate and household debt, interest payments will begin to bite. This in and of itself should act as automatic brakes on the economy. In this scenario, there will be buyers willing to go long these securities. It is just that they may do so at a higher rate than in recent past.
Thanks for reading!
