As of last Friday, per S&P Dow Jones Indices estimates, 1Q17 sales of S&P 500 companies were $293.82/share. This amounts to a decline of 2.4 percent quarter-over-quarter, but year-over-year sales were up 7.2 percent. This was the fastest quarterly growth rate since 4Q11, when sales grew 7.9 percent y/y. Sales have been progressively getting better since they contracted 3.8 percent in 2Q15.
Despite this improving trend, the S&P 500 large cap index (2391.17) has been appreciating faster than sales – hence elevated sales-based multiples.
Chart 1 calculates a price-to-sales ratio using a four-quarter rolling total of sales. On this basis, sales were $1,170.38 in 1Q17, for a price-to-sales ratio of highly elevated 2.02, pretty close to the 1999/2000 bubble peak.
From a valuation perspective, also using trailing 12 months of operating earnings, the S&P 500 does not trade cheap. The price-to-earnings ratio was 21.1 at the end of 4Q16. This gets better using forward estimates – 18.4x on 2017 estimates and 16.4x on 2018 (not shown here). The question is, will earnings grow into these multiples?
The question is a propos as we are in the midst of 1Q17 earnings season.
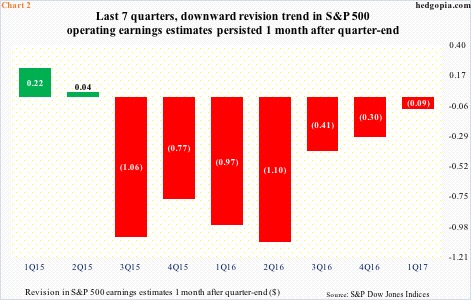
There is more than one way to skin an earnings cat. As such, Chart 2 highlights an improving revision trend seen thus far in 1Q17.
The bars in the chart show the amount by which earnings have been revised up or down within a month of a quarter-end. As earnings get reported during the first month of the subsequent quarter, revision can swing both ways.
For instance, in 1Q15, between March and April that year, estimates went up by $0.22. And, between September and October that year, they contracted by $1.06.
For the last seven quarters, including 1Q17, revision trend has been down, but with progressive improvement. In 2Q16, estimates were revised downward by $1.10. This improved to minus $0.09 in 1Q17 – $29.14 expected at the end of March versus $29.05 at the end of April.
Why is this potentially important?
Chart 3 shows revision trend for eight quarters of this year and next. (2017 estimates for 2Q16 are as of July 21, 2016.) Apparently, estimates are holding up.
In the aggregate, 2017 estimates came down from $141.11 in early January last year to $129.49 last Friday, and 2018 from $147.21 early January this year to $146.65 (Chart 4). For the past four months, however, both are essentially flat. Hence the need for continuation of the trend seen in 1Q17. If it comes to pass, this will represent a massive departure from the revision trend witnessed the last two years.
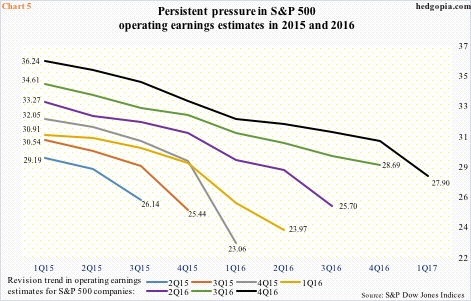
If we look back at 2015 and 2016, quarterly estimates progressively fell as time went by. For instance, 4Q16 estimates in 1Q15 were $36.24. When it was all said and done, the quarter ended up earning $27.90 (Chart 5).
That is not the route Chart 3 would like to go – or should go. That is not what U.S. stocks are priced for.
Thanks for reading!

