- Dollar continues to act well technically, amid signs of overcrowded trade
- U.S. exports’ share of GDP near all-time highs, means higher risk/reward to economy
- Strong greenback has not resulted in higher current account deficit last three years, a trend to fade?
For multinationals, navigating currency crosscurrents is always – or can get – tricky. This is particularly so at the present time as overseas economies are weak/weakening and not showing signs of pickup. A rising dollar in this environment is the last thing multinationals would probably wish for. Overseas revenues get converted into fewer dollars. As simple as that. Multiply that by x number of times, and it has the potential to impact the nation’s trade balance.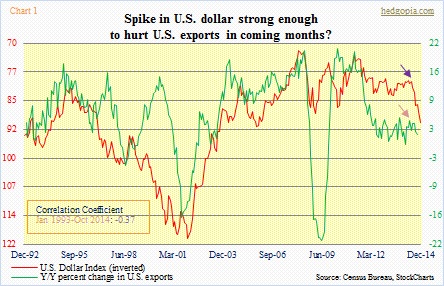
Since May this year, year-over-year growth in exports has indeed been decelerating (Chart 1) – from five percent (brown arrow) to 1.8 percent in October. The U.S. dollar index began its parabolic ascent in June (indigo arrow). It is possible the dollar has nothing to do with it. After all, it is not like economies overseas are going gangbusters. The R between the dollar index and y/y percent change in exports is a decent -0.37, but far from perfect. Nonetheless, correlation is there.
The greenback’s multi-year decline that began in July 2001 bottomed in April 2008. The dollar index had pretty much been going sideways until it began to break loose beginning May this year (Chart 2), going on to rise for six consecutive months. In seven short months, it is up 14-plus percent. This is a gigantic move in the currency world. We will find out in due course what impact this has had on multinationals’ business.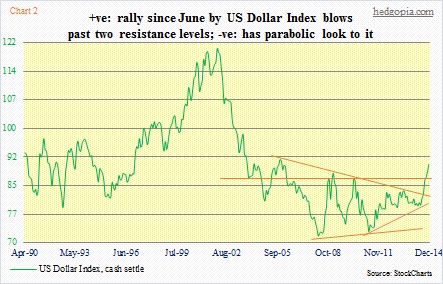
What we do know is this.
(1) As shown in Chart 2, the dollar has taken out two important resistance levels, spanning nine to 10 years (hence the importance of the breakout). This move has brought the index right up to a 30-year downtrend line (not shown in the chart). If the dollar manages to convincingly break out, dollar exports may need some prayers. The good thing is, the currency has expended so much energy to get to this level that it is probably primed for a breather. It is a crowded trade. Large speculators started seriously going net long U.S. dollar index futures in the middle of June and continued to add until the third week of September (Chart 3). Since then, they have cut back 44 percent. But it remains a decent size. (Positions are as of the 16th. The CFTC has not yet published the 23rd numbers.) The thing to watch: how these non-commercials react to when the dollar pulls back.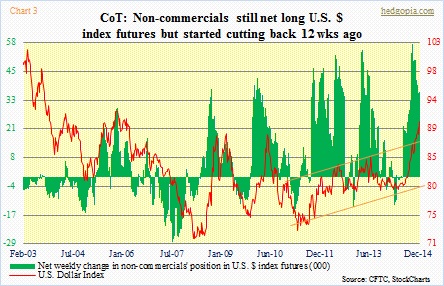
(2) U.S. exports’ share in GDP is near all-time highs – 13.4 percent in 3Q14 versus 13.7 percent in 3Q11. The post-war mean is less than eight percent. Time and again in the past, sustained weakness in exports’ share has been coincident with recession (Chart 4). This was the case even when exports accounted for only five, six percent of U.S. GDP. Their contribution now is substantially higher. With that grow risks to the economy should exports come under pressure.
Simply put, exports are too important a beast, come to think of it. They are one of the four components used to estimate GDP (expenditure approach) – consumption, investment, government spending, and net exports (exports minus imports). They can decide if a nation should have a trade surplus or deficit, and also go a long way in deciding the fate of the current account balance.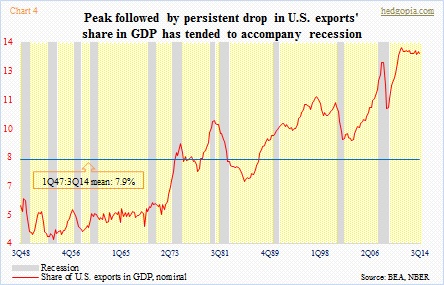
Now one can argue that the way we measure our trade balance is flawed, which by the way is not entirely untrue. Think of it this way.
The iPhone you are holding in your hand increases the nation’s import bills. In other words, Apple imports the iPhone it itself invented. Makes sense? For the uninitiated, Apple designs its products in the U.S. and outsources 100 percent of its manufacturing to China. Manufacturing them domestically would simply cost more. Plus, the whole supply chain is in that part of the world. So when Foxconn ships those iPhones to the U.S., they are counted as U.S. imports. That is also the case, let us say, when Chinese-made Nike shoes make their way to the U.S. Now not all of the LeBron 12 retail price of $200 goes to the Chinese manufacturer. Obviously. An iPhone 6 sets us back $650 (without contract), but Foxconn only gets to keep a small portion of that.
The point is, these products add to the nation’s import bills. They are treated the same way as a Sony camera or a Samsung TV. The only difference being the wealth created thereof accrues to Apple, Nike, or whoever. In the big scheme of things, Apple is the beneficiary, and as a corollary the nation. Reason why the company enjoys high gross margins, and is able to award shareholders. But how do we capture that? We can’t. We are only bound by the plain-vanilla exports versus imports equation.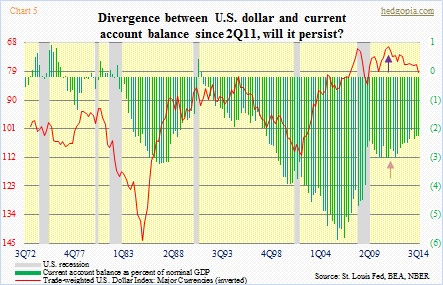
In this domain, a higher exchange rate is expected to lower the country’s balance of trade while a lower exchange rate would increase it. Ditto with the current account balance, which includes the trade balance as well as investment income, employee comp, and transfers. Chart 5 plots the trade-weighted U.S. dollar index (major currencies) with share of current account balance in nominal GDP. The two track each other well. Except they have diverged since 2Q11. The dollar index made a low of 69.50 (indigo arrow) before appreciating to 79.60 by 3Q14 (84 recently). The green bar stood at -3.1 percent in 2Q11 (brown arrow) and -2.3 percent by 3Q14. The balance has improved despite an appreciating dollar.
And this divergence is what multinationals are hoping for. Assuming the dollar rally is for real.

