In the first eight months, US corporate bond issuance remained soft – relatively. This is not due a sudden rise in risk-off sentiment toward corporate bonds. They remain well bid. Rather, reduced corporate buybacks for the most part may have something to do with it.
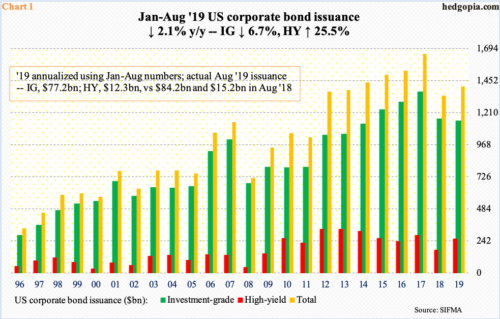
With eight months in this year, US corporate bond issuance is down 2.1 percent from the corresponding period last year to $939.8 billion, comprised of $766.7 billion in investment-grade and $173.1 billion in high-yield. Investment-grade is down 6.7 percent, while high-yield is up 25.5 percent.
We get a slightly different picture if we annualize the January-August total, which is on pace to grow 5.3 percent this year to $1.41 trillion (Chart 1). Here is the rub. Issuance in the remaining four months will have to jump 24.2 percent for this to come true. Even to break even with last year’s $1.34 trillion, issuance has to grow 5.3 percent in September-December.
After six consecutive years of growth, issuance collapsed 19 percent last year. When it is all said and done, issuance this year may not deviate much from last year’s total. The pullback from 2017’s torrid pace of $1.65 trillion is not for a lack of buyer interest, or due to a sudden rise in risk-off sentiment.
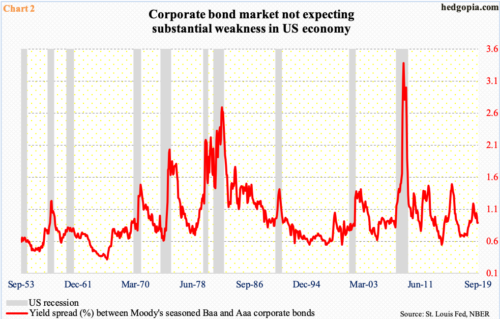
In investment-grade, Moody’s Aaa rating is the highest and Baa the lowest. Below Baa lie high-yield bonds. The spread between Baa and Aaa thus helps us get a sense of how investors view where the economy is headed.
Historically, the red line in Chart 2 begins to widen heading into a recession. As recently as last November, Baa bonds yielded 5.2 percent, versus the current 3.8 percent. The Baa-Aaa spread has narrowed to 89 basis points – the lowest in 13 months. There is no panic reflected in investment-grade corporate bonds.
This sanguine signal is in total contrast to the one coming from the US sovereign bond market, where several portions of the yield curve have already inverted, including yields on 10-year notes and three-month bills. Historically, 10/3 inversion tends to precede contraction in the economy.
The signal coming from the bond market is mixed. It is possible this is what is leading corporations to pull back their horns. It is equally possible their hands are tied as they are already sitting on tons of debt. As of 1Q19, corporate debt stood at $9.3 trillion, up from $5.5 trillion in 2008 (chart here).
Then there is the issue of corporate buybacks, which, too, have softened from last year’s heady pace.
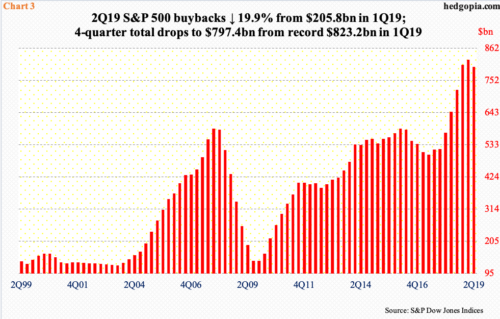
In 2018, S&P 500 companies spent $806.4 billion in buybacks – a record. Using a four-quarter total, buybacks totaled $823.2 billion in 1Q19 – also a record (Chart 3). The $205.8 billion spent in 1Q19 was the third straight $200-blllion-plus quarter, although the pace softened from record $223 billion in 4Q18. Then, come 2Q19, companies merely spent $165.7 billion – a six-quarter low. On an absolute basis, this is a still a big number, but versus where things were, represents quite a bit of deceleration. In the first half this year, buybacks went down by $57.2 billion. This understandably reduces corporations’ need for funds. If this is what is causing a reduction in bond issuance, then it is not as grave as if they were cutting back expecting substantial weakness in the economy.
Thanks for reading!

