
US home sales peaked in November 2017, homebuilder sentiment in December 2017, and housing starts in January 2018. From its January 2018 intraday high through December low, ITB collapsed 39 percent. It is trying to bottom, but currently in no-man’s land.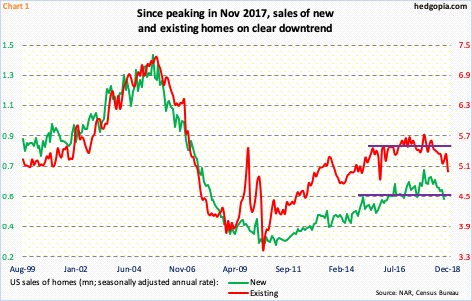
First off, due to the ongoing partial federal shutdown and a lapse in funding, the Census Bureau has stopped publishing data. The last print was on December 21. Several important series such as retail sales, durable goods, housing starts, and new home sales are not being updated.
Thus, to get a read on the prevailing housing trend, we have to rely on existing home sales, which is published by the National Association of Realtors. In December, sales of existing homes declined 6.4 percent month-over-month to a seasonally adjusted annual rate of 4.99 million units. They have been under pressure since reaching a cycle high 5.72 million units in November 2017. In that same month, new home sales reached a cycle high 712,000 units. In October – the last month for which data is available – sales of new homes dropped 8.9 percent m/m to 544,000 units (Chart 1).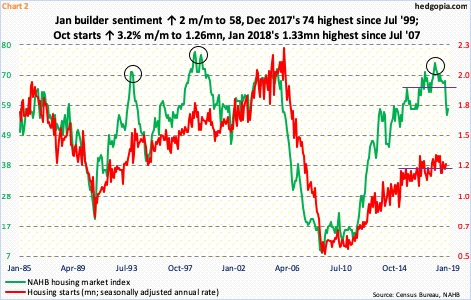
Homebuilder sentiment has taken a mini tumble. In December 2017, the NAHB/Wells Fargo housing market index rose as high as 74, which was the highest since 75 in July 1999 (Chart 2). In the next year, it fell 18 points, to 56. This month, it rose a couple of points m/m to 58.
Housing starts similarly have come under pressure. In January last year, they began to drop after reaching a cycle high 1.33 million units (SAAR), before dropping to 1.18 million by June. Starts were up 3.2 percent m/m to 1.26 million units in November.
Starts have more or less gone sideways for over three years now. In the past, whenever a gap has developed between starts and sentiment, the two eventually meet. Even after the recent drop, sentiment remains elevated. If the sharp drop in sentiment is anything to go by, builders do not expect things to pick back up in housing, at least not right away.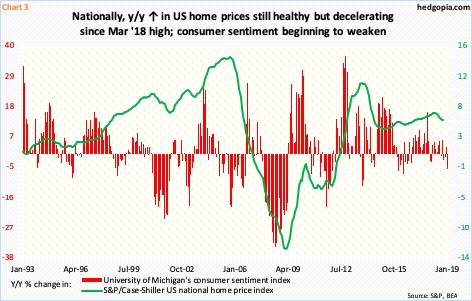
Price is catching up.
The median price of a new home reached an all-time high of $343,400 in November 2017; last October, it was $309,700. In existing, it peaked at $273,800 in June last year, with December at $253,600.
Chart 3 plots the year-over-year change in the S&P/Case-Shiller US home price index with University of Michigan’s consumer sentiment index. Nationally, the former increased at a 6.5-percent pace last March; by October, it had softened to 5.5 percent. The current pace of appreciation still supersedes inflation, but the trajectory is pointing down. Consumer sentiment is weakening. Last March’s 101.4 was the highest since January 2004. The preliminary reading this month was 90.7, down 7.6 points m/m.
The problem is that home prices galloped ahead while sales sauntered. Traditionally, how the former behaves will impact consumer sentiment, and with that sales of homes in due course.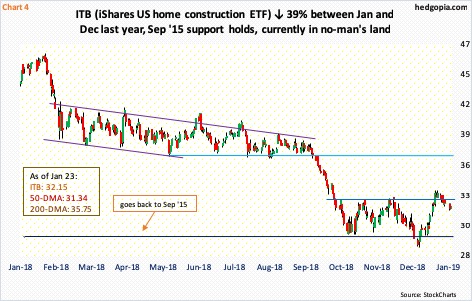
In this regard, how ITB (iShares US home construction ETF) behaves will be a signal how markets perceive where things are headed in housing.
The ETF ($32.15) peaked at an intraday high of $46.56 on January 24 last year – right around when sales, starts, and builder sentiment peaked. By the time ITB bottomed at $28.25 on December 26 last year, it had collapsed 39.3 percent. That low slightly breached $29.50, but bulls have defended that support several times in the past three months. It goes back to September 2015 (Chart 4). Concurrently, rallies have persistently been sold at just under $33. Housing bulls do not want to see ITB lose $29.50, even as a genuine break out of $33 opens the door to breakdown retest at $37. It is currently in no-man’s land. One way to play this is sell downside puts, or do a credit put spread, to position for a long near $29.50, but there is not much premium currently.
Thanks for reading!
