
After a 19-percent peak-to-trough drop, ITB defends crucial support Wednesday. Is this part of a normal correction or something is amiss in housing?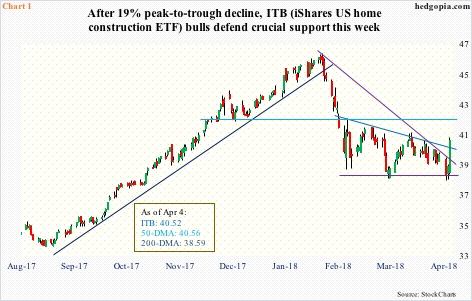
In the last several sessions, tons of stocks as well as equity ETF’s and indices were literally hanging by the thread – the 200-day moving average, that is. ITB (iShares home construction ETF) was one of them.
The ETF last tested the average early March – successfully. Also this time around, it was a successful test. Wednesday’s 4.6-percent jump not only saved the 200-day but also came within shouting distance of the 50-day, also rallying past shorter-term averages.
Wednesday’s action also meant two-month crucial support – part of a symmetrical triangle – was not violated (Chart 1). A breach could potentially push ITB a lot lower. That has been averted. For now, the bulls have wrested control of the ball from the bears.
The recent action preceded a peak on January 24, followed by a sharp drop into early February. From that peak through this week’s trough, ITB collapsed 19 percent. There are two ways we can look at this. One, this is normal. Particularly since last September, the ETF has had quite a rally. Two, there is something going on in housing, and it is beginning to get reflected in stocks.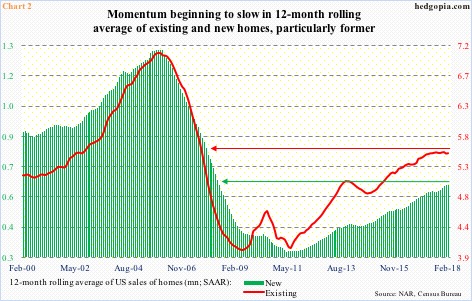
US housing has come a long way.
During the bubble era, sales of new homes peaked in July 2005 at a seasonally adjusted annual rate of 1.39 million units and existing in September that same year at 7.26 million. It was not until July 2010 that existing bottomed at 3.45 million and new at 280,000 in February the following year.
In February this year, sales of new homes fell 0.6 percent month-over-month to 618,000, while existing rose three percent m/m to 5.54 million. They both peaked last November – at 711,000 and 5.72 million, respectively – and are giving out signs of fatigue.
Chart 2 plots a 12-month rolling average of both new and existing. The latter has gone sideways to slightly down for 10 months now. The former is relatively hanging tough but could be in a process of doing the same.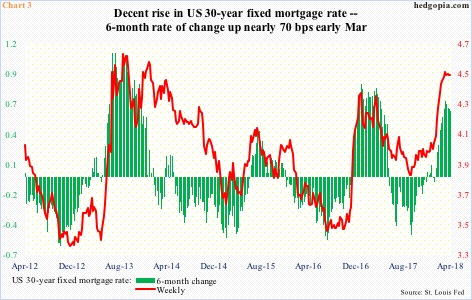
The flattish behavior comes at a time when consumer sentiment is at a multi-year high. University of Michigan’s consumer sentiment index rose 1.7 points m/m to 101.4 in March. This was the highest since 103.8 in January 2004.
Several other variables are not as cooperating.
Interest rates have crept up, although from a very low level. Although, it is not always the level but the rate of change that matters.
In September last year, the weekly 30-year fixed mortgage rate was as low as 3.78 percent. In early March this year, it had risen to 4.46 percent, which is about where it is at currently. In recent weeks, both the absolute level and the six-month change are flat to slightly trending down, but the damage may already have been done. This is so particularly so considering how home prices have behaved.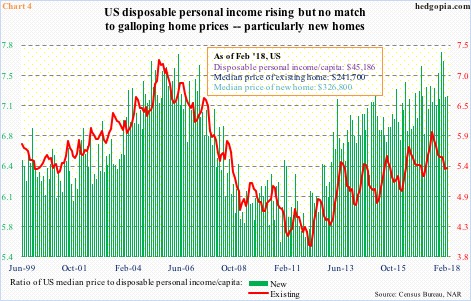
Sales are nowhere near the bubble highs, but prices have long surpassed the highs back then.
Most recently, the median price of an existing home reached an all-time high of $263,300 last June, while that of a new home rose to a record $343,400 last November. Prices were $241,700 and $326,800 in February.
The rise in the price simply galloped ahead of the rise in income. Chart 4 calculates a ratio between the median price of both new and existing and disposable personal income/capita. Off the lows six years ago, both ratios have trended higher, with the green bars in particular rising to a new high last November – 7.72 versus the prior high of 7.70 in April 2006.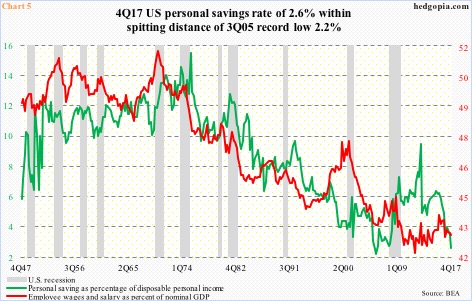
Interestingly, at the height of the housing bubble, the personal savings rate reached a record low 2.2 percent in 3Q05 (data goes back to 1Q47). The 4Q17 reading of 2.6 percent was not too far away from this. The savings rate has been under pressure since peaking at 9.2 percent in 4Q12.
This is a potential headwind to housing, as are interest rates – particularly if the uptrend continues – and the pricing trend.
Whether or not ITB ($40.52) is beginning to reflect this – hence the selloff that began in February – is a tough call. As mentioned earlier, the bulls this week stepped up to the plate just in time. If the ETF strictly trades on technicals, there is room to rally on the weekly chart. For now, resistance at $42 is the one to watch (Chart 1). If fundamentals are weakening, sellers will begin to appear at resistance, particularly if ITB rallies toward the late-January highs.
Thanks for reading!
