
U.S. corporate profits (adjusted for inventory valuation and capital consumption) broke a two-quarter downtrend in 2Q15, up 2.4 percent quarter-over-quarter to $2.06 trillion. This followed two consecutive quarterly drops in 4Q14 and 1Q15. A welcome change!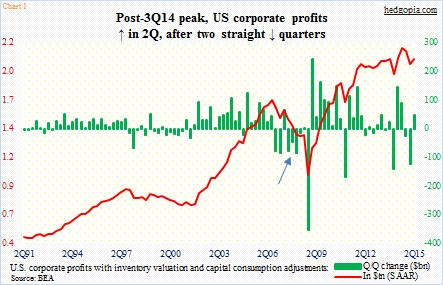
The back-to-back drop in profits in 1Q15 was the first in the current recovery. The last time profits fell for two straight quarters was back in 3Q06 and 1Q07. Back then, profits rose in 2Q07, only to drop the next four quarters, followed by a small uptick in 3Q08 and then a collapse in 4Q08 (arrow in Chart 1).
As things stand now, a comparison between the two periods is not even remotely relevant, except to point out that 3Q15 may be at risk of being a down quarter.
First of all, when numbers were reported yesterday, they were revised going back several quarters – most of it to the downside. Profits still peaked in 3Q14 – revised down from previous $2.17 trillion to $2.16 trillion.
Also yesterday, the second print of 2Q15 GDP was published. The 3.7-percent increase in real GDP was much better than the original print of 2.3 percent. There were upward revisions to non-residential fixed investment, to personal consumption expenditures, to state and local government spending, and to inventory investment. (On a side note, there was a huge discrepancy between real GDP growth and gross domestic income, which only grew 0.6 percent. GDP measures production, GDI the income generated from production. At least in theory, these two should be equal.) It is possible GDP gets revised lower when we get the third print.)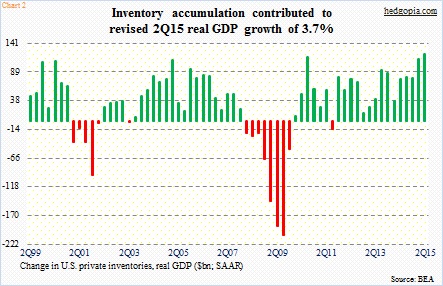
The accumulation of $121.1 billion in inventories, up from the previous estimate of $110 billion, is of note (Chart 2). That meant inventory build contributed 0.22 percentage point to real GDP. Originally, it was estimated to have subtracted 0.08 percent. This is a huge swing – and in all probability will adversely impact the third quarter. As of August 26, the Atlanta Fed’s GDPNow model is forecasting 1.4 percent growth in the third quarter.
This can reverberate through a whole host of things, not the least of which is corporate buybacks. The latter has been a reliable source of buying power for stocks, and profits as well as margins need to cooperate.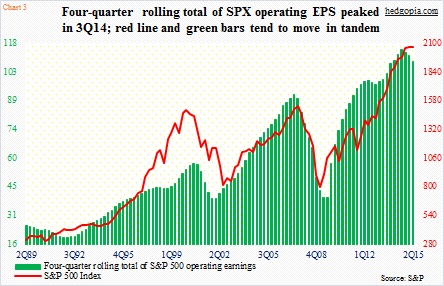
If we look at operating profits of S&P 500 companies, there is clear deceleration. The four-quarter rolling total peaked in 3Q14 at $114.51 – the same quarter corporate profits (Chart 1) peaked; 2Q15 was $108.41. Chart 3 uses quarter-end price for the S&P 500 Index, which closed at 2063.11 then. Since then, the red line, having dropped to 1867 by Monday, caught up with the green bars, before rebounding the past couple of sessions.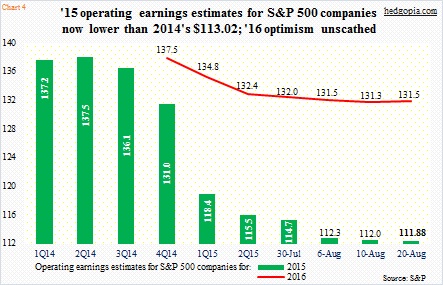
This is the reason why Chart 1 is important. Profits need to snap back, even as the third quarter is looking vulnerable. The concern is beginning to get reflected in consensus estimates. Sell-side operating profit estimates for S&P 500 companies this year have dropped to $111.88 (as of August 20th) – lower than $113.02 last year. By the end of 2Q14, 2015 estimates were $137.50 (Chart 4).
If the trend does not do a U-turn, watch that red line in Chart 3.
Thanks for reading!
