
As of last Thursday, a little over four-fifths of S&P 500 companies reported 2Q17 results. Of the 422 companies, 70.1 percent beat on operating earnings, 20.6 percent missed and 9.2 percent met, as per S&P Dow Jones Indices.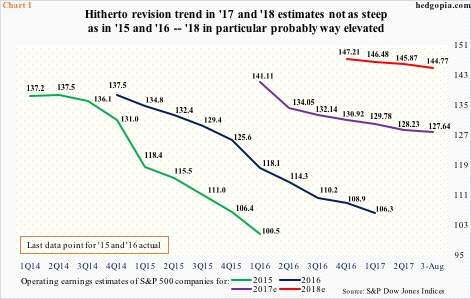
In the latest week (through Thursday), 2Q17 estimates went up by $0.33 week-over-week to $31.03. When the quarter came to an end, estimates were $30.97. Going back many quarters, actual earnings have come in lower than expected at the time of the quarter-end. From this perspective, the hitherto 2Q17 trend is an improvement, although one-fifth are yet to report.
The increase in 2Q17 estimates also helped push up 2017 estimates by $0.13, to $127.64, even as 2018 went down by $0.40 to $144.77. More important perhaps is the revision trend, which is down.
In January last year, 2017 was expected to come in at $141.11. In January this year, 2018 estimates were $147.21 (Chart 1).
The downward trend in 2017/2018 estimates is nothing new, considering how 2015 and 2016 fared. In both those years, actual operating earnings were substantially less than the sell-side’s original estimates.
As things stand, 2018 expectations look way elevated.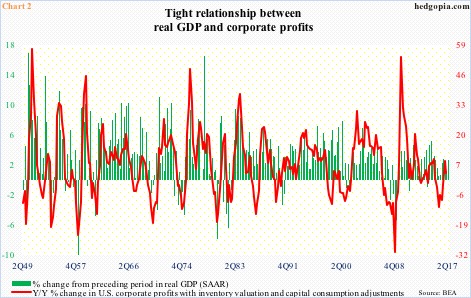
There is a tight correlation between GDP and corporate profits.
U.S. corporate profits adjusted for inventory valuation and capital consumption peaked at $2.23 trillion in 4Q14, with 1Q17 at $2.11 trillion. Since that peak, profits fell year-over-year in five quarters and rose in four, including gains of 3.3 percent in 1Q17.
Growth in real GDP peaked around the same time – in 3Q14, when the economy expanded at a 5.2 percent annual rate. In 2Q17, it grew 2.6 percent. This was higher than the post-Great Recession average of 2.2 percent, but much lower than the long-term average of 3.2 percent going back to 2Q47.
The economy is in its ninth year of recovery. Expecting it to accelerate at this time is probably a risky bet. That said, 2018 earnings estimates probably do exactly that.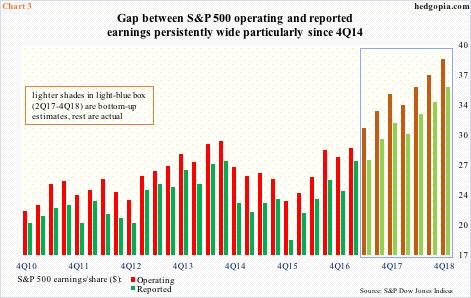
Valuation multiples are priced off of these estimates. Stocks are at/near all-time highs, with elevated multiples. Using trailing 12-month numbers as of 1Q17, the S&P 500 traded at 21.3 times operating and 23.6 times reported earnings.
Hence another equally important question, how clean are these estimates?
Chart 3 plots both operating (non-GAAP) and reported earnings (GAAP) of S&P 500 companies going back to 4Q10. (Except for the lighter-shade bars within the blue box, these are actual numbers.)
One distinct trend in particular since 4Q14 is that the gap between the two is widening.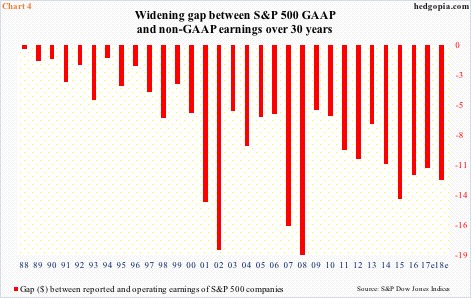
Companies are required to report GAAP earnings, not non-GAAP. Non-GAAP numbers are reported by the reporting company, but they do reconcile the two.
There are times companies have perfectly good reason to request/ask analysts/investors to ignore certain items. Irregular or non-cash expenses or one-time charges, for example.
Restructuring expenses, stock-based compensation, goodwill amortization are some of the non-GAAP exclusions. In general, this does tend to smooth out earnings volatility.
The problem arises when this becomes a permanent fixture. Stock-based compensation among many tech outfits, for example.
Chart 4 subtracts operating earnings of S&P 500 companies from reported earnings going back to 1988.
The difference was minuscule at the beginning. It began to grow circa 2000, and has stayed. In both 2002 and 2008, GAAP took a massive hit, as assets got impaired, so both these years are more of an outlier. But even excluding these, the trend is not getting better. The discrepancy between GAAP and non-GAAP is not narrowing.
This raises questions about the quality of non-GAAP earnings, which is what the investing community in general focuses on. This gap is easy to ignore in good times, but maybe not so when bad times hit.
Thanks for reading! Please share.
