
- Central banks’ increasing role in deciding fate of stocks
- R between S&P and Shanghai index breaks down due to CB activism
- N/T direction for U.S. stocks look promising but not M/T, as QE morphine is lacking
Did U.S. stocks go up because of Fed intervention or because of better fundamentals?
Cogent arguments can be made on both sides. The debate likely never gets resolved. There are ardent supporters in both camps.
For those who believe the Fed has played a major role can simply point to Chart 1. QE1 gets underway in the midst of a major sell-off in stocks, which then recover. QE ends, and stocks shudder again. They get re-energized, when another iteration of QE is unleashed, and on and on.
Stocks were once again coming under pressure as QE3 was coming to an end last October, but James Bullard, president of the St. Louis Fed, came to the rescue, saying the Fed should consider delay in ending QE as well as hinting that QE4 was a possibility. Stocks liked when they heard that.
Across the Pacific in Japan, stocks have responded very well to Abenomics, which has deployed three tools, one of which is aggressive monetary policy.
The latest example of central-bank activism and its positive impact on investor psyche has come from the eurozone. On January 22nd, the ECB announced its plan to buy €60 billion each month in public and private bonds. The German DAX has rallied nearly 20 percent since.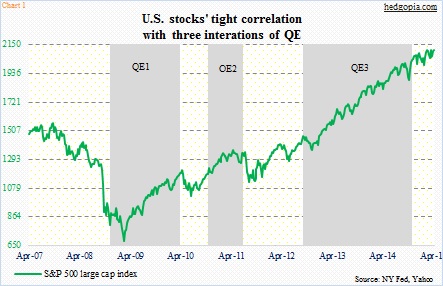
There was a time when stocks in Shanghai and New York moved hand in hand. Sort of.
Going all the way back to December 1990, the correlation between the S&P 500 large cap index and the Shanghai index was 0.68 – not perfect, but positive and decent.
Beginning September 2012, when QE3 was launched in the U.S., this relationship began to go haywire (Chart 2). U.S. stocks took off, but their Chinese counterparts went sideways. In fact, between December 1990 and September 2012, the correlation between the two was higher – 0.7. September 2012 onwards, this has weakened to 0.57.
Between September 2012 and last July, the correlation went negative – -0.31. U.S. stocks responded to QE, but policy was not loose enough in China. It was only last July Chinese stocks began breaking out of a long base. Investors were obviously anticipating a looser monetary policy, which came in November when the PBoC cut rates for the first time since 2012.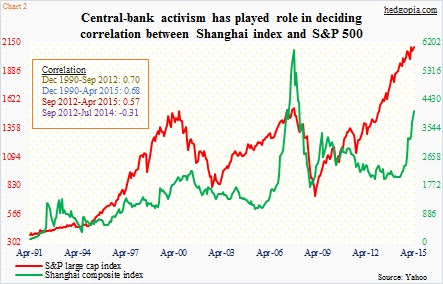
Fast forward to today, and we are beginning to hear commentaries as to if the correlation would once again establish itself. The Shanghai index has surged over 90 percent in nine months. And the hope is that this is a harbinger of things to come for U.S. stocks. Chinese stocks did lead U.S. stocks back in 2008.
Conditions are simply not in place for that to occur. With that said, U.S. stocks look good in the near-term.
Chinese stocks have responded to looser monetary policy, looser regulations (Beijing now allows up to 20 stock accounts), and a new-found love for stocks amidst a surge in margin debt (in the last two months, Shanghai has seen over 100,000 new trading accounts opened every day).
The only scenario in which U.S. stocks possibly – not probably – enjoy another tailwind is if they get another round of QE morphine. And that is probably not coming unless the economy begins to fall apart.
