
It seems buyback deceleration continued in 2Q17.
Based on results from 85 percent of S&P 500 companies, S&P Dow Jones Indices points out that buybacks are on course for a 10.4-percent decline quarter-over-quarter. Buybacks were $133.2 billion in 1Q17.
In the current cycle, buybacks peaked at $161.4 billion in 1Q16. The all-time high was recorded in 3Q07 at $172 billion.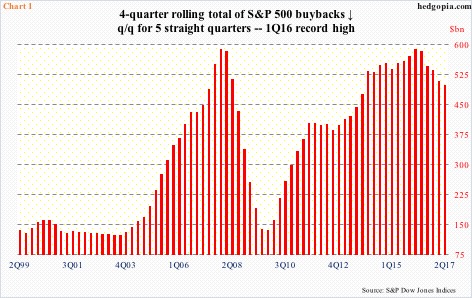
On a four-quarter rolling total basis, buybacks were $500 billion in 2Q17. This was the fifth consecutive q/q decline (Chart 1). They peaked at $589.4 billion in 1Q16, which essentially tied with the prior high $589.1 billion in 4Q07.
Back then, the peak in buybacks coincided with a peak in the S&P 500, which began its descent in October that year. This time around, the index has diverged.
During 2Q17, the index rallied 2.6 percent quarter-over-quarter.
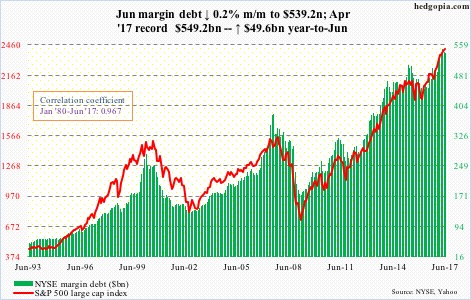
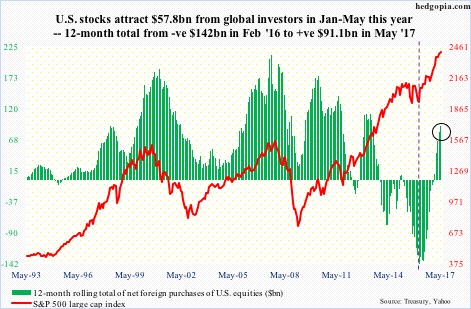
Although the S&P 500 has diverged with buybacks, it has moved hand in hand with other sources of cash, particularly margin debt and foreigners’ purchases of U.S. equities.
In February last year, U.S. stocks reached a major bottom. Since then until June this year, NYSE margin debt went up by $103.3 billion, and in 2Q by $2.2 billion (chart here).
Similarly, in April and May, foreigners net-purchased $15.1 billion in U.S. equities. (June numbers will be out later today.) In May, on a 12-month rolling total basis, $91.1 billion came in. This contrasts with net-selling of $142 billion in February last year (chart here).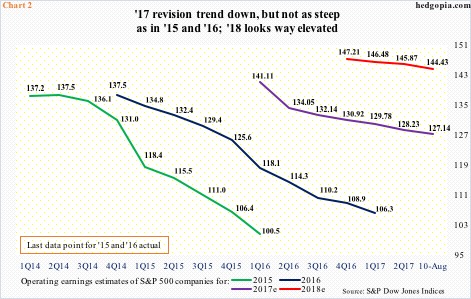
But because stocks have gone on to rally even as buybacks have receded, fewer shares were purchased, and this means a smaller tailwind to earnings per share.
Speaking of which through last Thursday 91 percent of S&P 500 companies reported 2Q17. In the latest week, estimates went down by $0.25 to $30.78. Since 2Q ended and companies began reporting results, estimates have been cut by $0.19.
The revision trend is also down for 3Q and 4Q. Once again, since 2Q ended, 3Q estimates have gone down by $0.57, to $32.83, and 4Q by $0.32, to $34.71. Accordingly, 2017 currently stands at $127.14, down $0.50 week-over-week. In January last year, this was $141.11.
In the aggregate, the revision trend evidently is down for 2017, but not as steep as was in 2015 or 2016 (Chart 2). Pie-in-the-sky 2018 is inching lower, but holding up.
This is where the current buyback trend will end up playing a role. Fewer share repurchases cut into EPS growth. In 1Q17, 255 S&P 500 companies reduced their share count, versus 281 for 4Q16 and 324 for 1Q16. The trend is down.
Thanks for reading!
