
- Retail sales up three months in a row, following three straight declines
- PCE, which includes services, probably better gauge of consumer behavior
- How consumer spending fares depends on consumers’ willingness to lever up
Once every month, U.S. markets await with abated breath to see how retail sales fared in the prior month. It is an important data to keep an eye on, as it involves consumers, who account for two-thirds of the economy.
The knock on this series is that this is not the best indicator to gauge consumer behavior. To start with, the data is not inflation-adjusted. So it is hard to figure out if growth – or lack thereof – is influenced by change in price or quantity. Secondly, it is heavily skewed towards goods. Except for restaurants, there is not much exposure to services, which comprise two-thirds of the economy. Currently, U.S. inflation is much higher in services than in goods.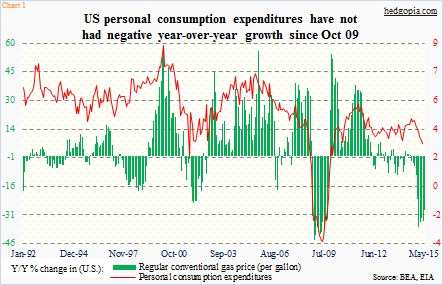 From this perspective, personal consumption expenditures are much better. They include services, and probably better reflect what is going on in the economy. Not surprisingly, PCE is much bigger in size – $12.16 trillion in April, essentially flat month-over-month; year-over-year, it rose 2.8 percent in that month. The last time PCE fell y/y was in October 2009. Although growth has decelerated from 4.4 percent last August (Chart 1).
In comparison, retail sales are much smaller. In May, they were $444.9 billion – a new high. April was revised higher from $436.8 billion to $439.6 billion; as a result, what was earlier reported as flat was revised higher to m/m growth of 1.1 percent. With that revision, retail sales have now been up three consecutive months, following three consecutive declines before that.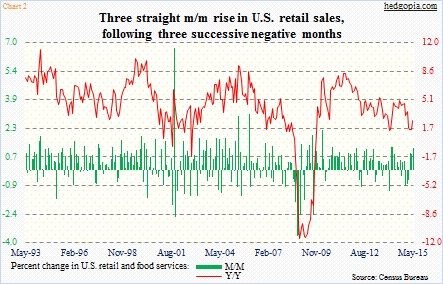
Chart 2 does not look as bad as it did a month ago. There are now three successive positive green bars, and the red line has hooked up. When April was reported a month ago, y/y growth was a mere 0.9 percent, which has now been revised higher to 1.5 percent. May was up 2.7 percent. It now has a respectable look to it.
With that said, sales have essentially gone flat since last November, when they were $441.4 billion. This is impacting the three-month average of sales. Using this measure, y/y growth had decelerated to 1.6 percent in April from 4.7 percent last October. May inched higher to 1.9 percent, but remains below 2.5 percent (Chart 3). There is plenty of work ahead.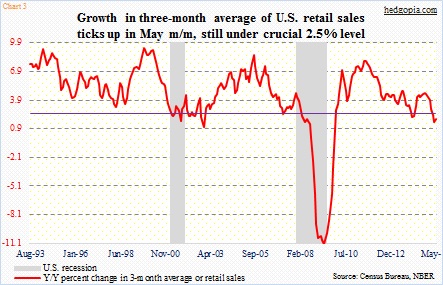
For the last several quarters, we have heard how lower gasoline price would help retail sales, but data is mixed on this. The price of regular unleaded gas dropped from $3.63/gallon last June to $2.05 in January, and then rose to $2.56 in May. Ex-gasoline, retail sales are holding their own (Chart 4). Sure, y/y growth in the three-month average has decelerated – from 6.2 percent in January to 4.5 percent in May, but the last time this metric went negative was December 2009.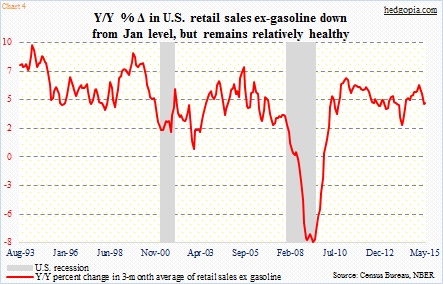
On the other hand, as seen in Chart 1, the correlation between PCE and gas price is not as tight as one might have imagined. Going back to September 1991, R is 0.48, which is positive but nowhere near perfect. Plenty of times in the past they have moved together. Since January, however, as the green bars have gotten smaller (due to the rise in gas price), the red line has come under pressure.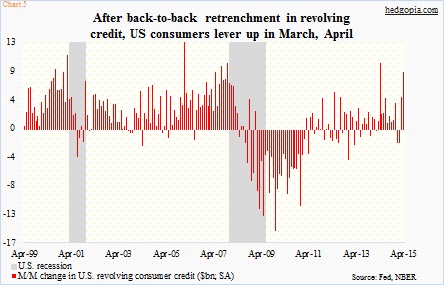
The role of leverage in the U.S. economy needs no elaboration. In May, total consumer credit (seasonally adjusted) stood at $3.38 trillion, a record. Of this, non-revolving credit was $2.48 trillion. When a consumer takes on non-revolving credit, once the line of credit is paid down, the account is closed. Home mortgages, student loans and auto loans are examples of this.
In contrast, in revolving credit the line of credit fluctuates depending on the customer’s cash-flow needs. These are essentially credit card loans, and used for operating purposes. In May, it came in at $899.5 billion. In January and February, revolving credit fell m/m. This was the first back-to-back drop since June-July 2012 (Chart 5). This was more than made up for in March and April, and probably was a tailwind for retail sales.
Jobs and wages are important, but so is consumers’ willingness to lever up. The role of consumer credit increasingly is taking on increasing role.
Thanks for reading!
