
- Disinflationary/deflationary pressures intensifying globally
- Fed favorite core PCE inflation persistently under two percent despite three QE’s
- Bonds do not see inflation as far as eye can see, signal slowdown in activity; stocks continue merry way
Monday morning, investors will learn how U.S. inflation fared in December. Not the plain-vanilla CPI (consumer price index), but one that the Fed puts high emphasis on. The Federal Open Market Committee focuses on core PCE (personal consumption expenditures) to get a read on underlying inflation. This is probably one of the few data points that could decide if the Fed moves this year or not.
Globally, the trend is not good. Germany became the latest example. We learned yesterday that inflation turned negative in that nation in January – for the first time in more than five years.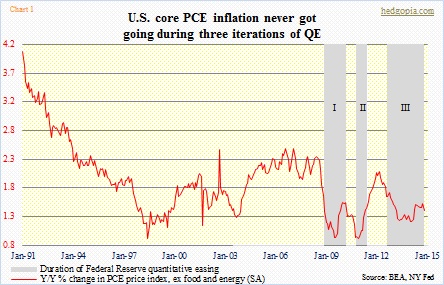
Here at home, as Chart 1 shows, core PCE inflation has not quite gotten negative – far from it – but the trend is not very encouraging either. As a matter of fact, the last time it sustained above two percent were months leading up to Great Recession. QE1 started in November 2008. A few months prior, in June 2008, core PCE inflation peaked at 2.32. It has not seen that high again. Throughout QE1/2/3, during which the Fed’s balance sheet surged by nearly $4tn, there were three months in which inflation stayed north of two percent – January through March in 2012.
All that QE money could not move the inflation needle. Particularly after QE1, inflation began to trend down as soon as QE was over. This time around, QE3 was wrapped up in October. In November, inflation dropped 12 basis points. Hence the importance of December. Was that November drop a fluke or the beginning of a trend?
Chart 1 also shows that inflation did get a nice bump during/after both QE1/2, but not so with QE3. The impact was much more muted during the third iteration of QE. That is the fear. Disinflationary/deflationary pressures are rampant globally. The dollar has stayed strong for seven months now. Form Japan to China to the Eurozone, they are all exporting disinflation/deflation.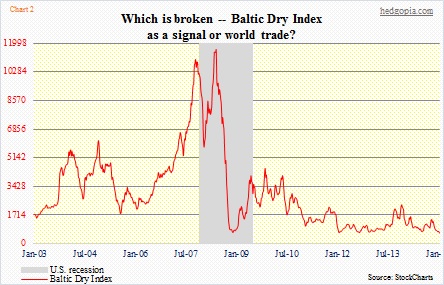
Nowhere is this more evident than in the Baltic Dry Index (Chart 2). It measures changes in the cost of moving raw materials such as grains, coal and metal by sea. Simply put, it pits the demand for shipping capacity with the supply of dry bulk carriers. The mismatch is just too wide to miss. The index has been more than cut in half since November last year, and has been persistently making lower highs since 2009.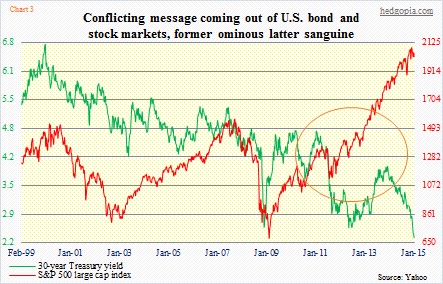
With this as a background, the core PCE inflation probably needs to cooperate if the Fed wants to proceed with its rate-hike plans this year. The bond market is not in agreement. Their signal is more in line with what is coming out of the shipping index. Which is that global economic activity is slowing down. Not if we listen to stocks, which have diverged from bonds (orange circle in Chart 3).
Who is right: bonds or stocks? Bonds get it. It will be a while before core PCE inflation gets to the targeted two percent and stays there.
