Company buybacks are having quite a bit of a dry spell. As corporate boards act thrifty this year, it has not had much impact on stocks. The buyback shortfall is being offset by bulled-up foreigners and investor willingness to take on leverage.

Company buybacks are running dry. With 95 percent of the data in, S&P Dow Jones Indices points out, S&P 500 companies spent $100 billion in buying back their own shares in the third quarter. This was up from $88.7 billion in the second quarter and down from $175.9 billion from a year ago.
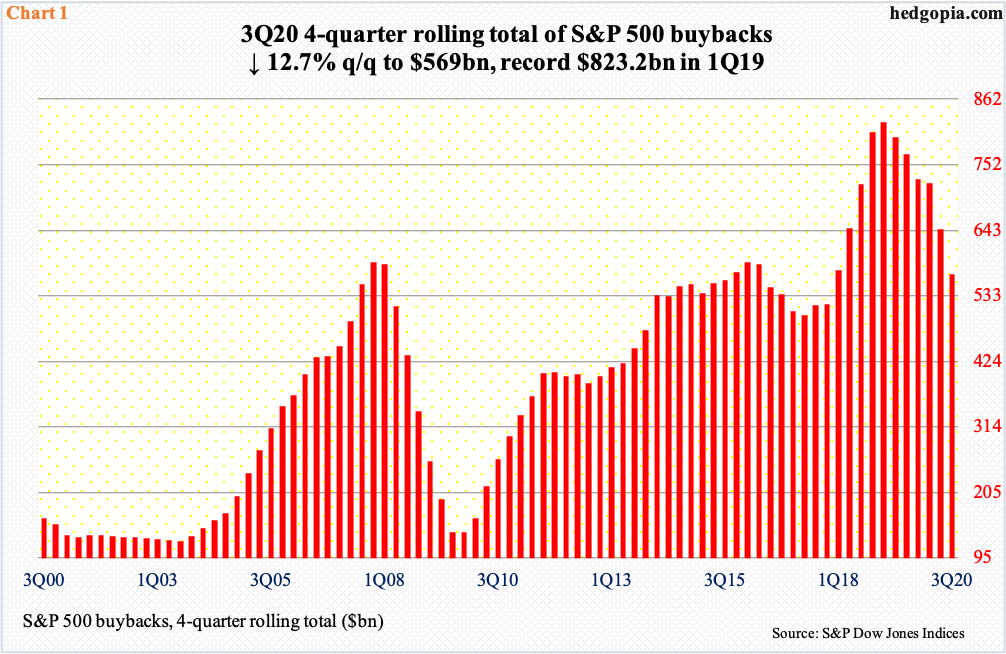
The 2Q total was an eight-year low, which was understandable given the US economy was right in the middle of Covid-19 recession. In 4Q18, these companies spent as much as $223 billion. That year, a record $806.4 billion was splurged, followed by $728.7 billion last year. On a 12-month basis, a record $823.2 billion was spent in 1Q19; on that basis, $569 billion was spent in 3Q20 – an 11-quarter low (Chart 1).

Despite the meaningful decline in buybacks this year, stocks are doing just fine. For the year, the S&P 500 large cap index is up 12.5 percent and the Russell 2000 small cap index 11.1 percent, even as the Nasdaq 100 index is up a huge 38.3 percent. Buybacks clearly are not the be-all-end-all, but there is no denying the fact they make up an important source of buying power.
In 2018 and 2019 in particular, buybacks provided a massive tailwind. In the four years before that – that is, 2014-2017 – companies spent $500-$600 billion in a year, which is what this year is shaping up to be. The y/y shortfall this year is likely offset by the increase in foreign buying of US stocks and in margin debt, among others.

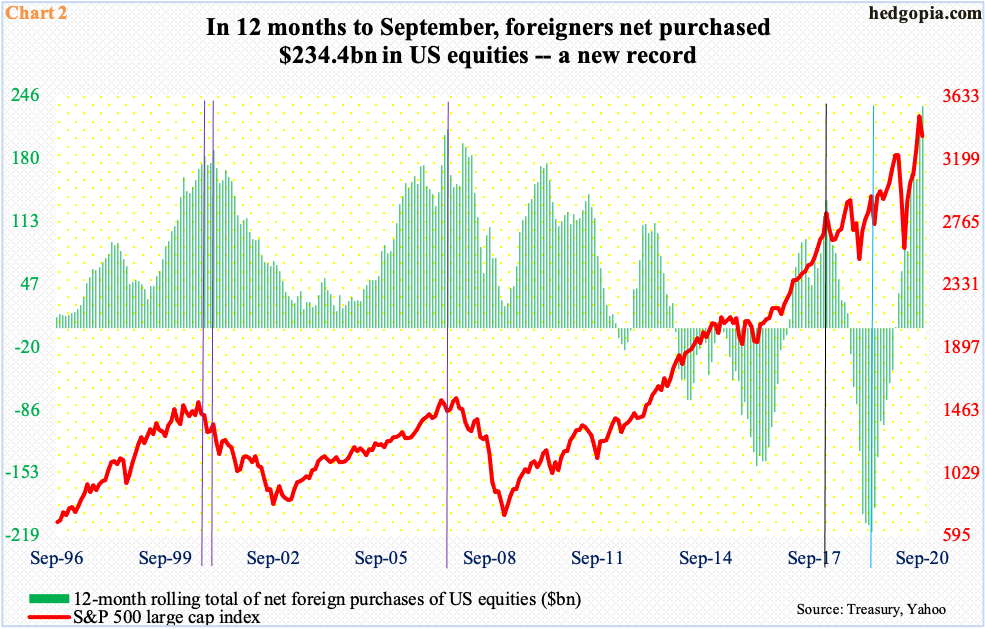
In the first nine months this year, foreign purchases of US stocks totaled $204 billion, versus selling of $29.9 billion in the same period last year. Of late, foreigners have been aggressively buying, with the 12-month total to September of $234.4 billion – a record (Chart 2). Historically, foreign purchases – or a lack thereof – and the S&P 500 move in tandem.
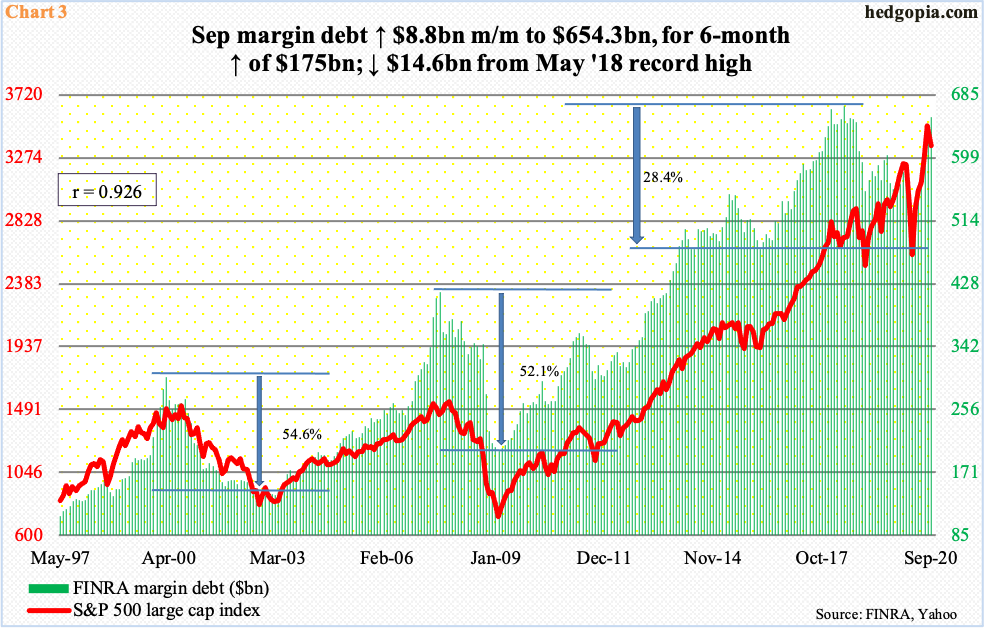
If past is prelude, stocks also tend to move hand in hand with margin debt. In September, FINRA margin debt rose $8.8 billion month-over-month to $654.3 billion, within striking distance of the record high $668.9 billion from May 2018 (Chart 3). In the first nine months this year, margin debt grew $75.1 billion, versus $24.9 billion in all of last year.
So far so good. But foreigners are also notorious for being late cycle. Although this metric comes with a lag, as October’s data is not out until mid-December, their behavior is worth watching. Similarly, October’s margin debt should be out next week, and will be a tell. Margin debt has gone up for six consecutive months to September. The S&P 500 dropped 3.9 percent in that month, and another 2.8 percent in October. Equity bulls should want to see a rise in margin debt in October as this can suggest willingness to take on risk in an otherwise risk-off environment.
Thanks for reading.

