
Bloomberg carried an article this Tuesday highlighting what it called shrinking cash piles at American companies. Cash and equivalents dropped to a median $860 million at S&P 500 companies in 2Q16. At the end of that quarter, cash ex-financial sector stood at healthy $825 billion, but the top 10 percent owned more than half the total.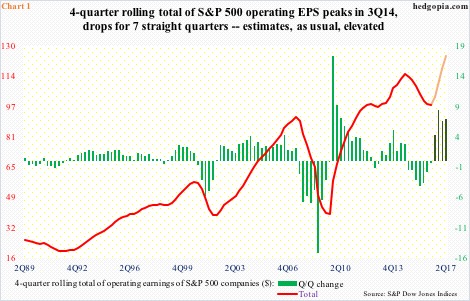
The crux of the problem lies in shrinking profits. Operating earnings of S&P 500 companies have dropped sequentially for seven straight quarters. Using a four-quarter rolling total, earnings peaked in 3Q14 at $114.51, before progressively dropping to $98.29 in 2Q16 (Chart 1).
Chart 1 also shows that the earnings picture would improve drastically beginning 3Q16 – both quarter-over-quarter and total. For that, estimates for the second half this year and the first half next year are used.
Next year, for instance, these companies are expected to earn $132.81 – already down from estimates of $141.11 in the middle of January this year. If 2017 estimates come through, earnings would have grown from an estimated $110.75 this year; in 4Q14, 2016 was expected to earn $137.50. Similarly, 2015 in 2Q14 was expected to earn $137.50, ended up earning $100.45, down from $113.02 in 2014. You get the picture.
These estimates are just that – estimates, and rosy at that. For the past several quarters, the revision trend in earnings has been decidedly downward.
This has not deterred S&P 500 companies from maintaining a healthy dose of both buybacks and dividends. In 1Q16, S&P Dow Jones Indices data show, these two totaled $257.7 billion – $161.4 billion in buybacks and $96.3 billion in dividends – accounting for 123.3 percent of operating earnings of $209 billion. In fact, this was the third straight quarter these companies splurged on buybacks and dividends more than what they took in operating earnings.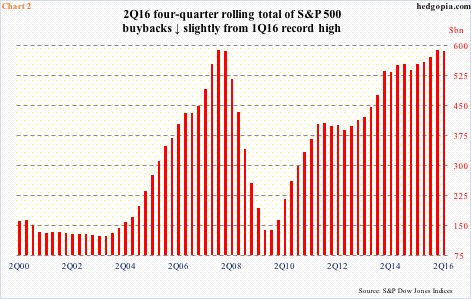
There are some early signs of buybacks beginning to soften. With 90 percent of the data in for S&P 500 companies, Howard Silverblatt, of S&P Dow Jones Indices, pointed out two weeks ago that 2Q16 was running 21 percent behind 1Q16. Buybacks, as stated earlier, were $161.4 billion in 1Q16 – the highest since $171.9 billion in 3Q07.
On a four-quarter tolling total basis, 2Q16 buybacks were $585 billion. The all-time high of $589.4 billion was recorded in 1Q16, nudging past the prior high of $589.1 billion in 4Q07 (Chart 2).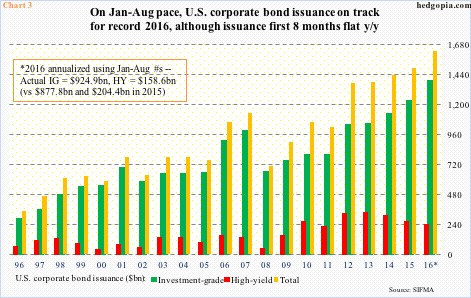
It is in this context it probably pays to pay attention to corporate debt issuance.
August numbers were just out. At first glance, issuance looks healthy, but a deeper look reveals early signs of sputtering.
January-August annualized, issuance is on track for $1.63 trillion this year. For that to happen, issuance should total $542 billion in the remaining four months. In the corresponding period last year, issuance was $411 billion. In other words, September-December issuance should jump 32 percent year-over-year. With high-yield issuance the way it is, it is just not going to happen.
With cash piles beginning to dwindle, earnings under pressure, and now debt issuance beginning to lose steam, the red bars in Chart 2 look vulnerable. They have been a big tailwind for stocks.
Thanks for reading!
