
U.S. corporate bond issuance totaled $99.7 billion in July, down 25.9 percent year-over-year. Of this, investment-grade was $85.2 billion, down 32.1 percent y/y and high-yield $14.5 billion, up 62.2 percent. The growth rate put up by high-yield is misleading as it was way suppressed last year.
In the first seven months this year, high-yield issuance totaled $134.8 billion, down 29.5 percent y/y. On this basis, investment-grade declined 3.1 percent. As did total issuance, which fell eight percent.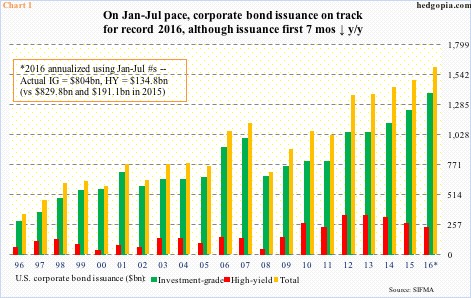
Given this, solely annualizing the seven-month total may not give us a true picture as to where 2016 might end up. On an annualized basis, 2016 is on course for $1.61 trillion – yet another record (Chart 1). But then again, annualizing the first seven months, 2015 should have come in at $1.75 trillion; actual issuance was $1.49 trillion.
The important thing to keep in mind is that issuance year-to-date is softer versus last year.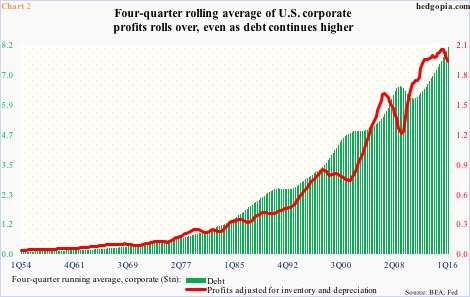
This in some ways is in keeping with Chart 2, which plots corporate debt with profits adjusted for inventory and depreciation, using a four-quarter running average. The latter peaked at $2.1 trillion in 2Q15 (actual peak was in 3Q14 at $2.16 trillion), while the former was still going strong at $8.1 trillion in 1Q16 (actual was $8.28 trillion in 1Q16). Turns out the red line tends to lead the green bars. Has not happened yet, but might, if past is prologue. This is a medium- to long-term issue.
Near-term, or immediately ahead, implications of softer debt issuance are likely to be felt in Chart 3.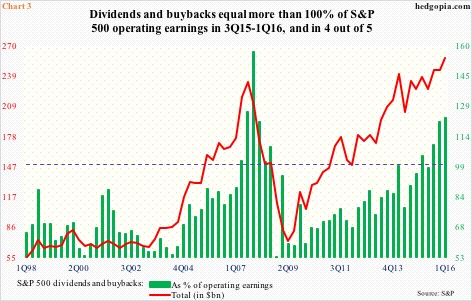
S&P 500 companies have been spending gobs of money buying back shares, totaling $161.4 billion in 1Q16. This was the highest since $171.9 billion in 3Q07. This is no chump change. As a matter of fact, including dividends of $96.3 billion, the combined $257.7 billion constituted 123.3 percent of 1Q16 operating earnings of $209 billion. This was the third straight quarter dividends and buybacks made up more than 100 percent of operating earnings … and in four out of five. Clearly not sustainable.
At this time, corporations can least afford to issue less debt. A lot is riding on Chart 1, and the remaining five months of the year.
Thanks for reading!
