
U.S. corporate earnings have been in serious deceleration. This is no news. They have been decelerating for a while now.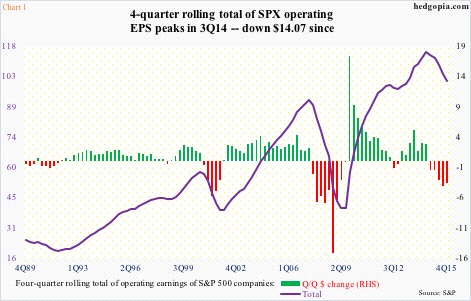
Operating earnings of S&P 500 companies peaked at $29.60 in 3Q14, and have declined for five straight quarters annually.
Chart 1 uses four-quarter rolling total. It too peaked at $114.51 in 3Q14, dropping to $100.44 by 4Q15. The five red bars on the right side of the chart is second only to the collapse in earnings in 2008-2009.
This has implications for Chart 2.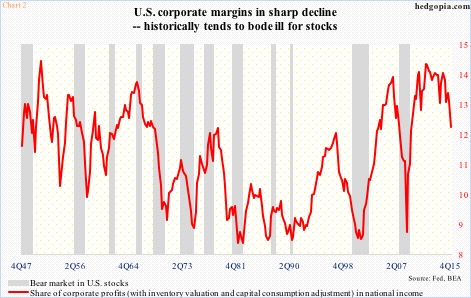
The chart uses corporate profits before tax adjusted for inventory and depreciation. They were $1.91 trillion in 4Q15, down from the peak $2.16 trillion in 3Q14. Once again, profits peaked at 3Q14, and are down 11.5 percent from that peak.
The red line in Chart 2 is corporate profits’ share in U.S. national income – a proxy for corporate margins.
Most recently, it peaked in 3Q14 at 14.16 percent. By 4Q15, it had dropped to 12.18 percent – a rather sharp drop.
Historically, the longer this persists, and margin shrinkage continues, the risk of a bear market rises. In the chart, grey bars represent bear market in U.S. stocks. Evidently, a sustained drop in the red line has not been good to stocks.
Unless, of course, earnings do a 360, and the red line turns back up.
What are the odds of that happening?
Not very good, if we base our opinion on what has happened to earnings for at least the past couple of years.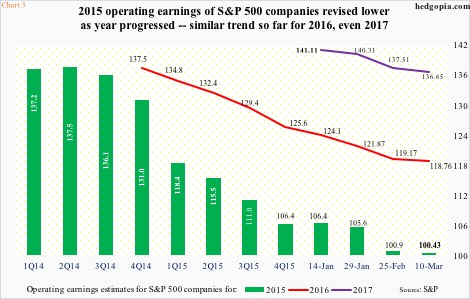
Because growth has been sub-par in the current cycle, GDP forecasts have persistently been revised downward. Ditto with earnings estimates.
At the end of 2Q14, 2015 operating earnings estimates of S&P 500 companies were estimated to come in at $137.50. Actual earnings were $100.43.
Similarly, as early as February last year, 2016 was expected to earn $137.50, which has now been revised downward to $118.76. By the way, if realized, this would still represent 18-plus percent growth this year over 2015!
The year 2017 – not surprisingly – has started out very optimistic. Two months ago, it was expected to earn $141.11. Estimates have now come down by nearly $4.50, to $136.65.
The point is, actuals have persistently fallen short of projections. And given how mature the cycle is and given these lofty expectations, in all probability downward revision continues.
This raises the risk that margins continue on their downward path, in which case Chart 2 becomes more and more relevant.
Thanks for reading!
