
Last week, the euro rallied two percent. There was some positive news on the fundamental front. Eurozone bank lending grew 1.1 percent year-over-year in March, slightly faster than February’s one-percent growth. Eurozone GDP expanded 0.6 percent in 1Q16 – the fastest pace in a year, and up from 0.3 percent in 4Q15.
But perhaps the strongest tailwind came from Japan where on Thursday the central bank shocked markets by voting against more stimulus. The yen reacted by surging 2.4 percent, the Nikkei collapsed 3.6 percent.
The US dollar index fell 0.7 percent on Thursday and another 0.8 percent on Friday, as a result losing crucial support.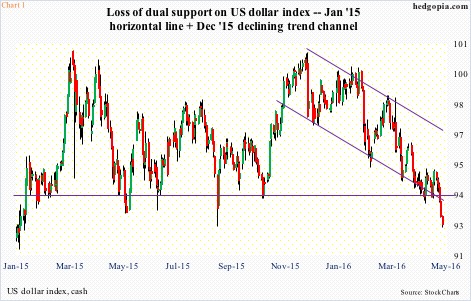
The dollar index peaked in March last year. That high was tested in November – unsuccessfully. Then it came under pressure, with four of the past five months in the red. After the Bank of Japan decision last week, it lost support at 93.50 (Chart 1).
This coincided with the euro breaking out of resistance at 114-114.50, which goes back to January last year. The corresponding resistance on FXE, the CurrencyShares euro ETF, lies at 111.50-112. Come Monday, it broke out (Chart 2).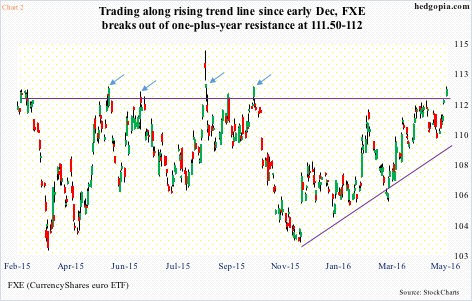
The US dollar index (92.62) shed another 0.4 percent Monday, and lost another support, this time dropping out of a five-month channel.
In more ways than one, the current euro strength is more of a weak dollar story.
The US dollar index is comprised of six currencies with the following weights: the euro, 57.6 percent; the Japanese yen, 13.6 percent; the pound sterling, 11.9 percent; the Canadian dollar, 9.1 percent; the Swedish krona, 4.2 percent; and the Swiss Franc, 3.6 percent.
As far as the euro/FXE is concerned, if the breakout sticks, it will be a major development. Several times in the past year, the ETF has broken out of the afore-mentioned resistance, only to retreat (arrows in Chart 2). Is this destined to be a similar false breakout? Too early to tell. That said, since early December last year, it has been making higher lows – positive.
Post-breakout, shorts have a decision to make – whether to continue to remain short, cover, or deploy some options strategies.
As a reminder, hypothetically on April 13th FXE was shorted at 111.28. Then on April 26th, rather than covering for a profit of $1.32, a covered put was deployed. (Duh!) April 29th weekly 111 puts were sold for $1.50. If assigned, the position would be liquidated for a profit of $1.78. Else, the price FXE was shorted at would rise to 112.78.
As things stand now, the breakout should be respected, even though the odds of its once again being false are high.
Covering FXE (112.49) for a profit of $0.29.
Thanks for reading!
