
The S&P/Case-Shiller U.S. national home price index advanced 5.2 percent year-over-year in October. This was the fastest growth since July last year. However, annual price appreciation has been decelerating since peaking at 10.9 percent two years ago.
The October 2013 peak looks substantially weak compared to the 14.5 percent annual growth in September 2005, but does not look as bad on an inflation-adjusted basis (arrows in Chart 1).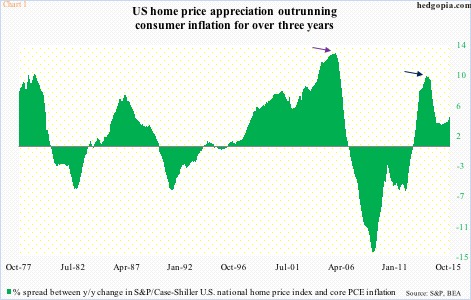
Back then, core personal consumption expenditures (PCE) inflation was running at 2.1 percent annual pace. This October, it only grew 1.3 percent. Inflation has remained suppressed for a while now. The last time this measure of inflation – the Fed’s favorite, by the way – increased at two percent annually was in April 2012.
As a result, home prices have been appreciating much faster than inflation.
This has implications for consumer spending.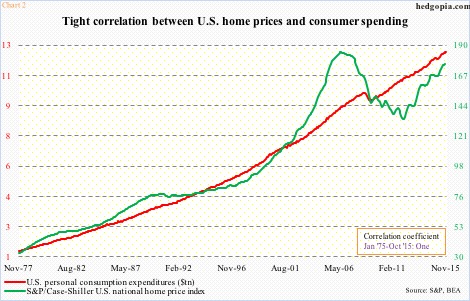
Historically, personal consumption expenditures have uncannily moved in tandem with how home prices have fared. Going back four decades, the correlation is a perfect one (Chart 2).
The S&P/Case-Shiller index dropped 27 percent between the July 2006 bubble high and the February 2012 low. After they troughed, home prices began to appreciate again. PCE only had a minor blip between July 2008 and April 2009. At $12.4 trillion, it was at a new high this November, even as the S&P/Case-Shiller index, at 175.7 in October, is still below the July 2006 high of 184.6. That said, they do move in tandem.
With this as a background, the deceleration in the S&P/Case-Shiller index cannot be helping consumer spending.
In the post-bubble period, home prices rose much faster in relation to sales. Chart 3 depicts this phenomenon well.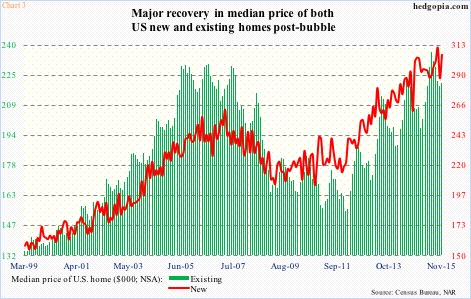
During the bubble, the median price of a new home peaked at $262,600 in March 2007, which was surpassed for the first time in February 2013 ($265,100). Since then, there have been normal ups and downs, but the median price has been on a steady ascent, with September recording an all-time high of $310,400 (Chart 3).
On the existing side, the median price peaked at $230,400 in July 2006. This was surpassed in June this year ($236,300).
The rapid recovery in home prices is already crimping sales.
In November, sales of new homes increased 6.3 percent month-over-month to a seasonally adjusted annual rate of 490,000 units, but were down 10 percent from the post-bubble high of 545,000 in February this year (Chart 4).
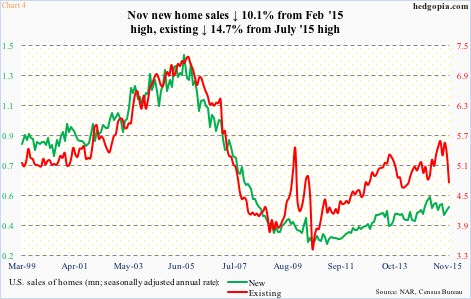
Similarly, existing home sales fell 4.1 percent in November to a seasonally adjusted annual rate of 4.76 million units. This was the first time in nine months that sales came in below five million. November sales were 14.7 percent below the post-bubble high of 5.58 million in July this year.
Amidst weak wage gains in particular, if sales are to gain traction, price needs to behave next year. And, as Chart 2 shows, this can easily reverberate through consumer spending.
Thanks for reading!
