
Corporate bond issuance in December simply collapsed. In that same month, Steven Mnuchin held talks with major US banks to make sure they had ample liquidity. While this does not help shore up investor confidence, other metrics such as the TED and corporate bond spreads are not ringing alarm bells.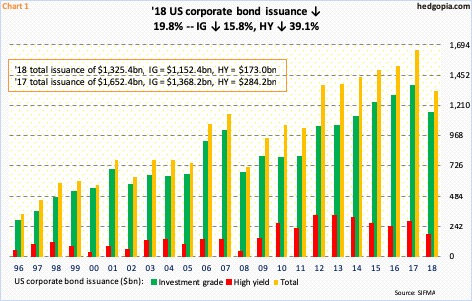
December went through a lot. US stocks tumbled. Manufacturing dove. The ISM manufacturing index declined 5.2 points month-over-month to 54.1, which was the lowest since November 2016. The m/m drop was the widest since October 2008. Orders declined 11 points m/m to 51.1. With that said, services held up, with ISM non-manufacturing orders inching up two-tenths of a point m/m to 62.7. As did jobs. The economy produced stronger-than-expected 312,000 non-farm jobs in December.
Amidst all this, corporate bond issuance ground to a halt in December. Literally! Merely $9.2 billion was issued, made up of $8.6 billion in investment-grade and $600 million in high-yield. This brings up 2018 total issuance to $1.33 trillion, made up of $1.15 trillion and $173 billion. This compares with $1.65 trillion, $1.37 trillion and $284.2 billion in 2017, in that order – down 19.8 percent, 15.8 percent and 39.1 percent.
The 2018 decline in overall issuance comes after six consecutive years of growth (Chart 1). The abysmal December issuance in particular is noteworthy. Was this a reason why Treasury Secretary Steven Mnuchin held talks with the heads of six largest US banks pre-Christmas? He apparently wanted to find out if the banks had ample liquidity available for lending.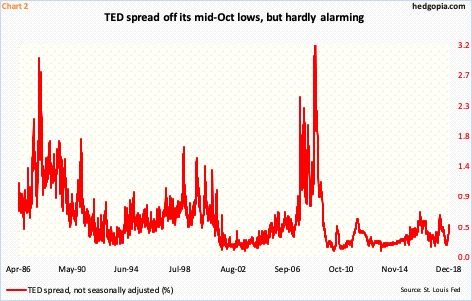
Stocks were in the midst of a brutal selloff when Mnuchin made those calls. Maybe that is what drove him. No one else on the Street was worried about liquidity at the time. This could very well have backfired, except several market-derived metrics were anything but suggesting a credit crunch.
The TED spread is the difference between the three-month LIBOR and the three-month Treasury bill rate. T-bills are considered risk free. LIBOR is the rate banks charge each other for short-term loans. In normal times, LIBOR tends to be a few tenths of a point above the fed funds rate. The TED spread measures the difference between what investors demand from the US government and what they charge large banks. A rise in the spread suggests default risk on interbank loans is increasing.
This is hardly the case right now. Toward the end of December, the spread was 45 basis points, which is higher than what it was mid-October but nothing alarming. The spread was much wider even in March-April last year (Chart 2).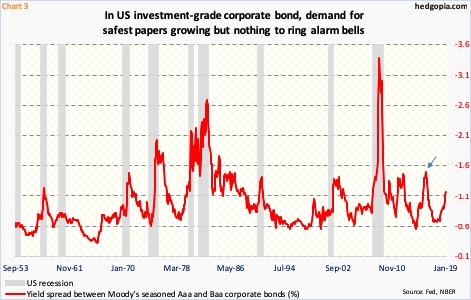
In the US investment-grade corporate bond space, using Moody’s ratings, Aaa represents the safest bonds. Below Baa is non-investment, which means in investment-grade it is the least safe. The lower the rating, the higher the yield. Thus, the spread between the two tells us the risk – or a lack thereof – markets perceive in Baa bonds.
Going back to 1953, the average Aaa-Baa spread was minus 97 basis points. Recently, it rose to minus 116 basis points. This is higher than minus 67 basis points in September 2017, but not even as high as minus 149 basis points in December 2015 (arrow in Chart 3). Typically, the spread begins to widen leading up to or during a recession. This takes place as investors move money into safer bonds. This is indeed taking place, but not at a worrying pace.
Thanks for reading!
