
As we approach next year’s presidential elections, the debate surrounding the U.S. corporate tax rate is destined to get louder. One side argues corporations are already taxed at very high rates. The other side says they far from pay their fair share. It is a controversial topic, and not likely to get settled any time soon. But, as can be expected, the issue has investment implications.
Federal tax rates on corporate taxable income apply at graduated rates – ranging from 15 percent to 35 percent. All taxable income is subject to tax at 34 percent or 35 percent where taxable income exceeds $335,000. The top U.S. rate is the highest among developed economies.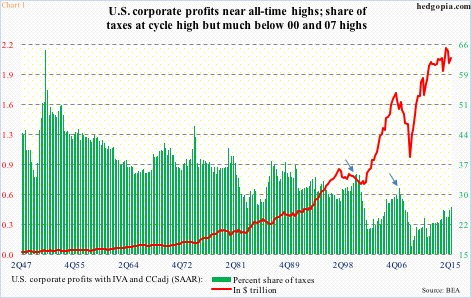
Enter Chart 1, which offers at least two important – and relevant – takeaways.
1. The red line represents U.S. corporate profits adjusted for inventory valuation and capital consumption (seasonally adjusted annual rate). They were $2.06 trillion in 2Q15, not too far away from the all-time high of $2.16 trillion 3Q14. Back when Great Recession ended, profits were $1.3 trillion, and corporations paid $240.4 billion in taxes – 18.5 percent of profits. In 2Q15, taxes amounted to $546.1 billion, for 26.5 percent of profits.
The effective tax rate is much lower than the nominal rate because of tax shelters and tax havens. Besides, the amount represents total taxes, not just federal.
2. The green bars in Chart 1 have risen substantially from 1Q09, but are way below 2000 and 2007 highs (arrows). This has helped corporate margins, and in theory should help retained earnings.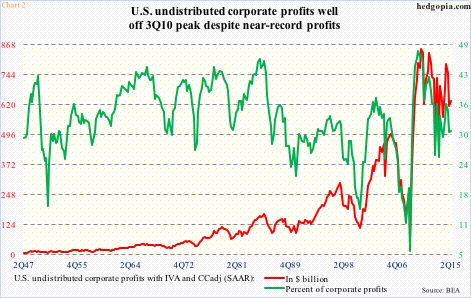
However, the red line in Chart 2, which represents undistributed profits adjusted for inventory valuation and capital consumption, has been declining since 3Q10 ($850.5 billion then, versus $634.4 billion in 2Q15). As a result, as a share of corporate profits, it has been falling. In 2Q15, only 30.8 percent of corporate profits was retained. Because net dividends have gone up noticeably, with the four-quarter rolling average having risen from from $524.2 billion in 2Q10 to $871 billion in 2Q15, although the pace has decelerated (not shown here).
Why is this important? Chart 3 is the answer. Corporate buybacks have been one of the main bulwarks of this bull market. The chart breaks it down by years, and the trend has been straight up since 2009. For 2015, FactSet points out that share repurchases by S&P 500 companies were $134.4 billion in the second quarter (July), and $555.5 billion on a trailing 12-month basis. And this! Spending on buybacks exceeded free cash flow for the first time since October 2009. This is not sustainable.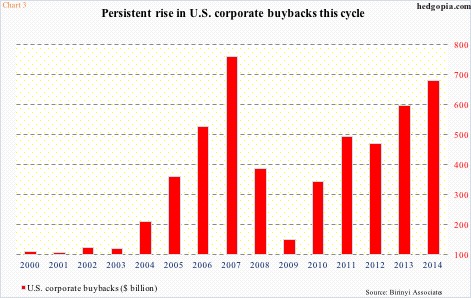
Hence the significance of Charts 1 and 2. As a percent of profits, the effective tax rate is already low. And profits are in deceleration. The only possible way for the red line in Chart 2 to move up is through reduction in dividends – not stock-friendly. This dynamic is a potential problem in the making as far as Chart 3 is concerned.
Thanks for reading!
