Crude oil peaked in June 2014. As months went by and the price decline picked up momentum, there were growing worries as to if this would force major oil exporters to begin to unwind their Treasury holdings.
Obviously this would reverberate through the long end of the yield curve.
This was then followed by yuan devaluation in August last year by the People’s Bank of China. China was already witnessing capital flight. The spread between onshore and offshore yuan was markets’ way of betting that the currency would continue to weaken. Once again, there were worries that China would be forced to sell some of its Treasury holdings in order to defend its currency.
Both were/are valid concerns. As the largest holder of Treasury securities, China in particular has the potential to be a notable swing factor.
So far, both these worries are just that – worries.
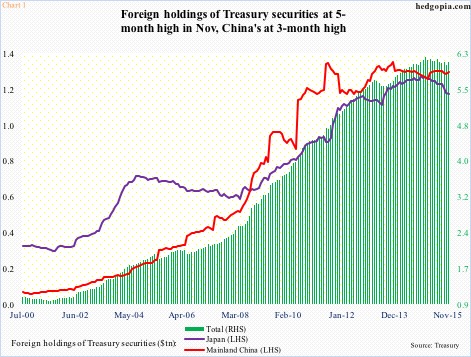
China’s in particular is an interesting case. Last year, its foreign exchange reserves dwindled by nearly $600 billion to $3.3 trillion. (Reserves peaked at nearly $4 trillion in June 2014.) Yet, its Treasury holdings have gone up from $1.24 trillion in December 2014 to $1.26 trillion in November (the latest month for which data is available).
Overall, foreign holdings of Treasury securities were at a five-month high in November at $6.13 trillion. China’s was at a three-month high… its holdings peaked at $1.32 trillion in June 2013 (Chart 1). The bottom line: China’s holdings are holding up just fine.
Oil-related holdings are the same way.
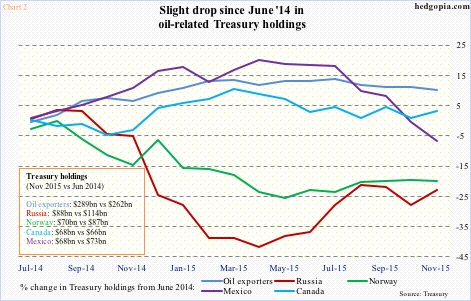
In Chart 2, percent change in oil-related holdings has been calculated from the month crude oil peaked – June 2014. The five entities – oil exporters (essentially OPEC), Russia, Norway, Canada, and Mexico – held $583 billion worth of Treasurys in November. This is no chump change, hence worth a close watch. Back in June 2014, their holdings totaled $602 billion, so they have gone down by $19 billion. Not a whole lot given the role oil plays in these economies.
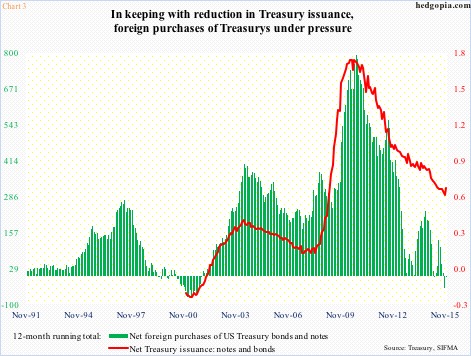
It is worth mentioning that foreigners’ net purchases of Treasury notes and bonds move in tandem with net Treasury issuance (Chart 3). It is easy to see why. As the U.S. runs a deficit, countries ranging from China to Japan to OPEC park their export dollars in Treasurys. As deficit begins to shrink, so do foreigners’ purchases of Treasurys.
That said, as stated earlier, foreigners hold $6.13 trillion in Treasurys – less than $100 billion from the peak of $6.22 trillion in January last year. Oil-related entities continue to hold a good chunk of this.
So is the fear related to holdings of China and oil-related entities misplaced? Too soon to say for sure, but the trend so far raises no cause for alarm.
If there is one thing to be alarmed about, it is on the equities side.
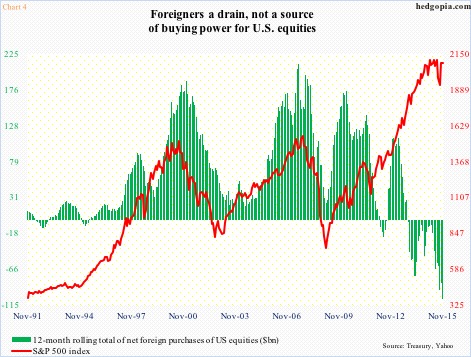
Foreigners have been actively exiting U.S. stocks. In August through November last year, they sold $66 billion in U.S. equities. The last time the 12-month running total was positive was back in October 2013; November last year was minus $107 billion – the highest monthly total ever.
In Chart 4, historically the green bars and the red line have shown a tendency to move in tandem, except the relationship broke down more than two years ago. It is belatedly catching up. In the chart, the S&P 500 index uses November’s closing price. Using yesterday’s close, the index would have been 220 points lower.
Thanks for reading!

