
There is a divergence in progress in the U.S. job market. Historically, non-farm job creation and openings move in tandem. They are currently going their separate ways.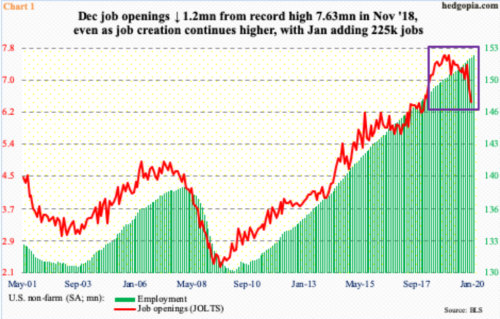
In December, non-farm job openings fell 364,000 month-over-month to 6.42 million. They have trended lower since peaking at 7.63 million in November 2018, which works out to a decline of 1.2 million from the peak.
Job creation, on the other hand, is still going strong – relatively speaking. In January, 225,000 non-farm jobs were added, to 152.2 million – a new record. Yes, momentum has decelerated, but it is hanging in there. Last year, the U.S. economy averaged 175,000 new jobs on a monthly basis, down from 193,000 in 2018. In 2014, the monthly average was as high as 250,000.
Hence the importance of job openings. They tend to lead. It is early to panic, but the red line in Chart 1 deserves close monitoring.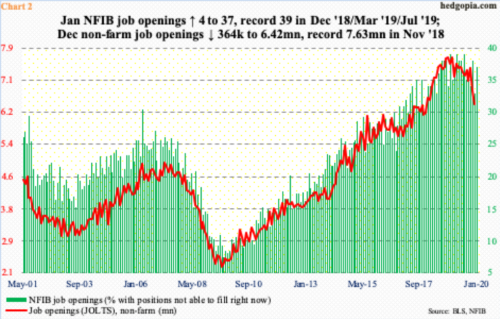
JOLTS job openings also move hand in hand with NFIB (National Federation of Independent Business) job openings (Chart 2). In January, the sub-index, which measures small-business activity, rose four m/m to 37. It is well within striking distance of record high 39, which was hit three times between December 2018 and July 2019. At the same time, it increasingly feels like the metric hit the wall at that level.
Thus far, non-farm and NFIB openings have diverged a bit. Once the latter begins to follow the former lower, this could potentially impact – negatively, of course – the overall employment picture.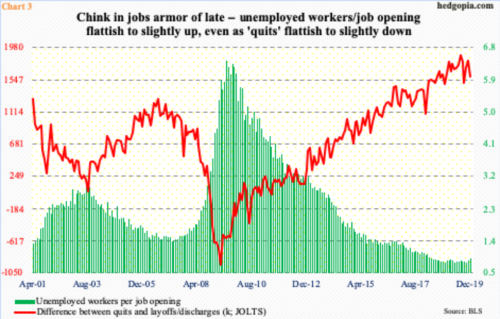
Chart 3 sheds further light on these dynamics. The green bars divide unemployed workers by non-farm job openings, while the red line subtracts JOLTS’ ‘layoffs and discharges’ from ‘quits’.
JOLTS data goes back to December 2000. From that date through February 2018, there were more unemployeds than there were job openings. A crossover occurred in March that year and has stayed that way (chart here), although the two are now beginning to go the opposite ways. In January, there were 5.89 million unemployed, up from 5.75 million last September; job openings in the meantime, as stated earlier, are down by a decent amount from the November 2018 peak.
A healthy job market would not want to see the green bars sustain higher. Neither should the red line sustainably head lower. When jobs are plentiful, workers feel comfortable quitting, as they are confident of finding a new one in no time. In December, ‘quits’ fell 80,000 m/m to 3.49 million, even as ‘layoffs and discharges’ rose 127,000 m/m to 1.90 million. Most recently, ‘quits’ peaked at 3.67 million last July, while ‘layoffs and discharges’ have risen since posting 1.69 million last March.
The bottom line is, the subtle change currently seen in the U.S. job market could be nothing more than the usual ups and downs within a cycle or things could very well be in transition. We just do not know yet. Hence the need to pay close attention to these metrics in the months to come.
Thanks for reading!
