
U.S. capacity utilization inched up 0.8 percentage point month-over-month in November. The 80.1 reading is the highest since 80.3 in March 2008. It is inching ever closer to the four-decade-plus average of 80.6 (going back all the way to January 1967). While this shows how far the current recovery has come, no matter how sub-par it looks from several other metrics, this brings into focus the zero interest-rate policy adopted by the Fed since the last recession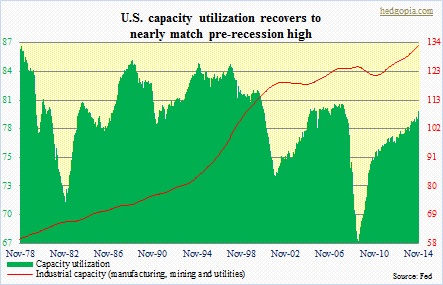
Going back seven recessions, every time capacity utilization begins to move up as recession ends, fed funds has followed suit. Not this time. In the chart below, the green line has absolutely gone flat even as the red line has recovered 13.2 percentage point from 66.9 percent in June 2009. When capacity utilization peaked at 80.8 in December 2007, fed funds was 4.2 percent.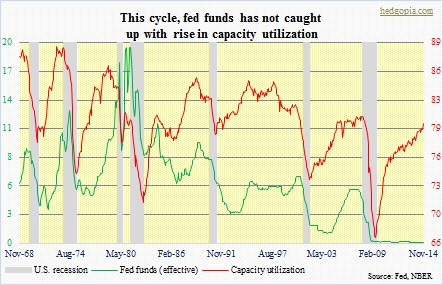
This is important from two respects.
(1) Back then, as recession took hold, the Fed had arrows in its monetary quiver in the form of fed funds. Not so know.
(2) ZIRP encourages/forces investors to get on the risk curve and take unnecessary risk in search of yield. The energy sector has been a fertile ground for this phenomenon. In 2008, the sector made up eight percent of the Barclays U.S. Corporate High Yield Bond Index. As of mid-October, this had nearly doubled to 15.4 percent. Persistently available cheap money is what enabled this. And now it is bombing on us.
