
The 2Q16 earnings season is winding down. As of August 3rd, 430 of S&P 500 companies have reported results, with 297 beating (69.1 percent) on operating earnings, 40 meeting and 93 missing. (By now, 453 have reported, so the above data is a little old, but serves to drive the point home.)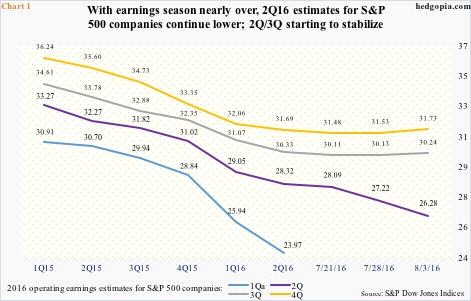
Shockingly, operating earnings estimates for the quarter went down further, to $26.28, down $0.94 from July 28th. From the time 2Q ended – about five weeks ago – estimates have been slashed by $2.04. Not to mention they were as high as $33.37 in 1Q15.
The persistent drop in estimates even as companies are reporting results only helps drive up multiples using the last 12 months. On that basis, the S&P 500 trades at 21.3x operating earnings – the highest since 3Q09. Using a four-quarter rolling total, operating earnings peaked at $114.51 in 3Q14, and were $98.75 in 2Q16.
Most market participants would prefer to focus on forward estimates. (It is a different discussion altogether as to if, given persistent downward revision, forward estimates are a reliable indicator at all.) In this respect, some good things are beginning to happen.
Chart 1 presents quarterly operating earnings estimates for 2016, with actual results for the first quarter and estimates for the remaining three. Incidentally, when 1Q ended, estimates for the quarter were $25.94; several weeks later, when it was all said and done, only $23.97 were earned. In 1Q15, these estimates were $30.91.
Notice the persistent decline in 2Q16 estimates in Chart 1. Also notice estimates for 3Q and 4Q that are now beginning to hook up, with 3Q having gone from $30.11 two weeks ago to $30.24, and 4Q from $31.48 to $31.73. In 2015, they respectively were $25.44 and $23.06.
Should 2H estimates come through this year, this would obviously represent quite a turnaround. Multiples would improve to 17.3 on operating earnings – still not cheap, but much better versus using trailing 12 months.
Built into these assumptions are expectations that the energy complex has seen its worst from the drop in crude oil and that the rally in the U.S. dollar is over.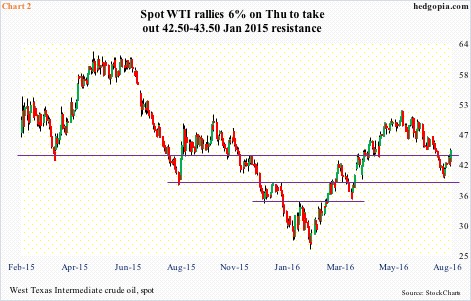
Between June 2014 and February 2016, spot West Texas Intermediate crude ($44.23/barrel) crashed nearly 76 percent. This was then followed by a four-month, 98-percent rally, which then gave way to a 24-percent drop into the first week of August (Chart 2).
Oil rallied six percent on Thursday, on the hope that OPEC’s informal meeting in late September would come up with plans to cut production. The 50-day moving average lies at $46.06.
Where oil goes from here can help make or mar 2H16 earnings estimates. Quarter-to-date, spot WTI has averaged $43.97. In the corresponding quarter last year, it averaged $46.49, and in 2Q16 $45.96.
Simplistically, if oil goes sideways for the rest of the current quarter, it witnesses no price tailwind – both quarter-over-quarter and year-over-year. Similarly, in 4Q15, the daily average price was $42.33 – only slightly lower from the current level.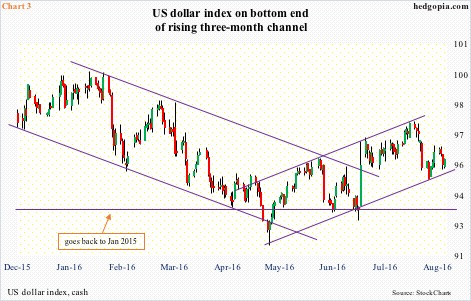
The US dollar index (95.84) is in the midst of similar dynamics (Chart 3). Between July 2014 and March 2015, it rallied nearly 26 percent. The March high was unsuccessfully tested in November that year, followed by a drop of nearly nine percent in the next five months to early May.
Since that March 2015 high, the dollar index has essentially been trapped in a 93-101 range, suggesting that in a larger scheme of things it is likely no longer hurting earnings.
Truly, in 2Q16, for the first time in four quarters exports did not subtract from real GDP (Chart 4). But how about 3Q and 4Q?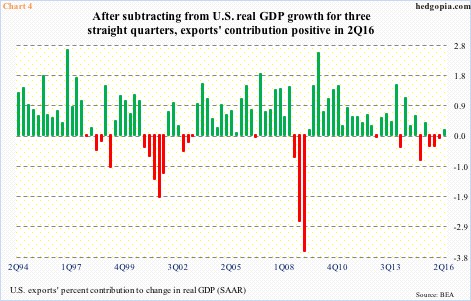
Quarter-to-date, the dollar index is averaging 96.35, versus 96.50 in 3Q15 and 94.50 in 2Q16. In 4Q15, it averaged 97.7. Once again simplistically there is not much currency tailwind to speak of, unless it craters in the remaining months of the year.
Technically, the weekly chart does have room for unwinding of overbought conditions. That said, the inability/unwillingness of the Fed to hike rates should have negatively impacted the dollar index, but it is hanging in there.
Put it all together – considering both oil and dollar dynamics – 2H operating earnings estimates are a big toss-up, with a downward bias.
Thanks for reading!
