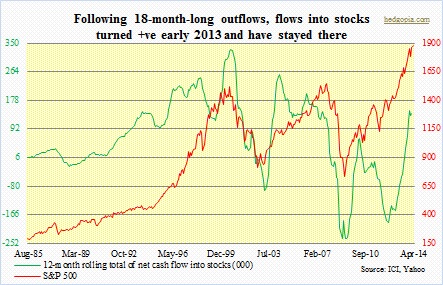
 One of the common themes that we so often hear is that there is a lot of dry powder still left to push stocks higher. Bulls have been steadfast in holding on to their gains. Yes, there were sell-offs in 2010, 2011 and 2012, but in a big scheme of things, those turned out to be buying opportunities. Last year was even better, as there was not much selling pressure. Net new cash flow turned positive right at the beginning of 2013 and has since stayed in the positive (ICI data is as of February this year).
New cash (into equities) can come from various sources, of course.
One of the things that we have been constantly hearing about is the inevitability of money flowing out of bonds and into equities. Has not happened yet – at least not to the extent expected. It may be oversimplifying the issue a little bit, but if that money wanted to leave bonds en masse, that would have happened already. Equity valuations are now higher, and the business cycle older. At least for a year now, any time the 10-year yields 2.7 percent to three percent, buyers appear for the notes. One wonders why this should change – given the lackluster nature of the economic recovery.
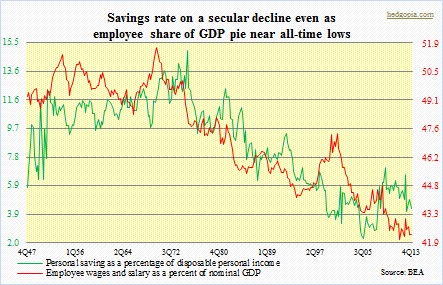
 As of January this year, as a percent of total mutual fund assets, liquid assets were 3.6 percent – historically very low. Theoretically, ‘retail’ can always send these funds new money. But what are the odds? I don’t need to labor the point here, but as the accompanying chart shows, employees have not fared very well versus employers. Their share of nominal GDP has been on a secular decline since the 1970s, and since 2001 following a brief rise leading up to the 2000 bubble.
It should be pointed out that compared to the past mutual funds are not the only game in town. Exchange-traded funds (all funds, not just equity) are now $1.7-trillion strong versus $70 billion early 2001, so this group holds a lot of heft as well. Nevertheless, mutual funds are still the ones with the most buying power – over $15 trillion, nearly $8 trillion of which are in equities. So that 3.6-percent number above is still relevant and important to keep a keen eye on.
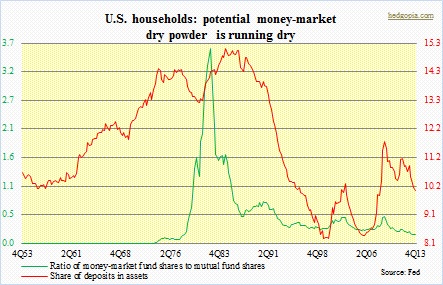
 This becomes doubly important when we bring the money market variable into the equation. As of April 23rd, money-market fund assets stood at $2.6 trillion, of which retail was over $900 billion. At the start of 2008, there was $3.2 trillion overall and $1.2 trillion retail. The accompanying chart says it all. The ratio of money-market fund shares to mutual fund shares among U.S. household is at all-time lows. And the share of deposits (‘checkable deposits and currency’ plus ‘time and savings deposits’) in assets has been trending lower since 2009. In other words, not much dry power to speak of.
Throughout all this, margin debt has consistently risen, which has provided a reliable source of steady inflow into equities. It is at a new high, and, needless to say, looks way extended. The risk of this unwinding is not now. Rather it is after equities suffer some sustained pressure, and that is when the risk of a call goes up, which in turn raises the odds of a self-fulfilling prophecy.
I have no longs now, and now short.

