
In recent weeks, there has been a slight improvement in revision trend of operating earnings estimates for S&P 500 companies, but it is too soon to declare a new trend has begun.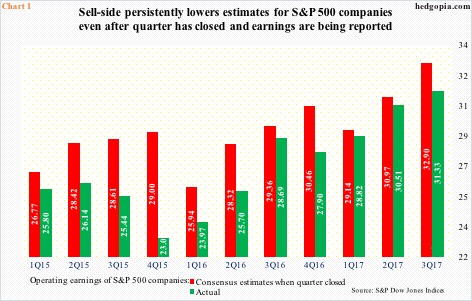
In fact, the downward revision trend persisted in 3Q17. Estimates continued lower throughout the reporting season. When the quarter closed in September, $32.90 was expected. When it was all said and done, $31.33 was earned.
The third quarter is not an exception. This routinely takes place.
Chart 1 plots earnings estimates when a quarter closes and what the quarter actually ends up earning. At the start, the sell-side customarily remains optimistic, and is forced to lower estimates as the reporting season progresses. Plus, there are companies that miss estimates, exerting downward pressure on the blended number.
If there is no change in this trend, these companies likely report less than $34.30 in 4Q17, which is where estimates were as December ended.
Incidentally, some level of stability in 4Q17 estimates could be noticed. Estimates have inched higher from $34.25 in the middle of November. As a matter of fact, 4Q17 estimates were $34.79 when 2017 began, versus $33.73 for 3Q17, meaning 4Q17 has held up better.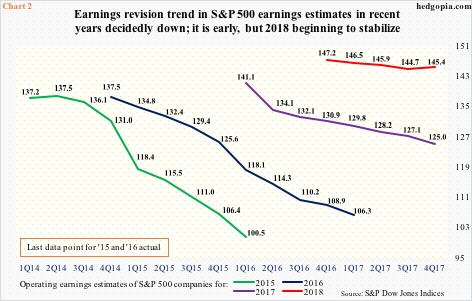
This recent improvement in 4Q17 revision trend extends to 2018, with estimates for all four quarters inching higher of late. As a result, 2018 estimates have now hooked up (Chart 2). The year has just begun, so it is a little premature to declare the beginning of a new trend.
Besides, in at least the prior three years – 2015-2017 – estimates persistently headed lower throughout the year. The curve was particularly steep in 2015 and 2016, with 2017 down but not as steep.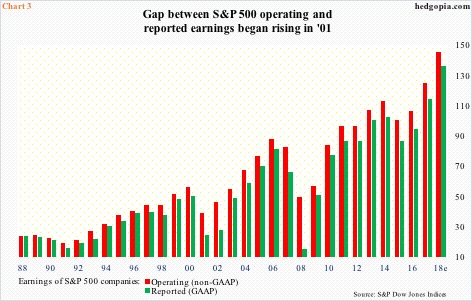
Let us assume for a moment that there has indeed been a change in the revision trend and that 2018 estimates will be met, would that then also help bridge the prevailing gap between GAAP and non-GAAP earnings?
Not really.
In Chart 3, the green bars represent reported numbers (GAAP) and the red ones operating (non-GAAP). The delta is wide, having begun to widen as early as the turn of the century. Go back to the ’80s, and the gap was miniscule.
This obviously leaves a lot of room for those doubting the quality of non-GAAP earnings. Indeed, going back to 1988 – encompassing three recessions and earnings cycles – the compounded annual growth rate (CAGR) of GAAP earnings was 5.58 percent, versus 5.84 percent for non-GAAP.
Once again, if we include 2018 estimates, the CAGR jumps to 5.99 percent GAAP and 6.17 percent non-GAAP.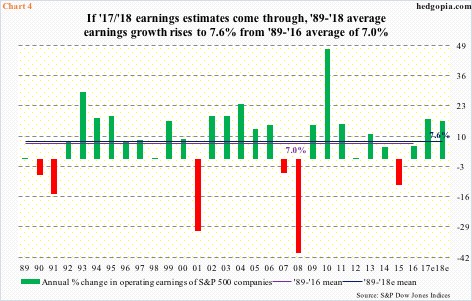
This year, earnings are expected to rise 16.3 percent. In 2017, assuming 4Q comes through, earnings would have grown 17.6 percent. This is above-average growth, and is all set to push the average growth rate up.
Between 1988 and 2016, earnings grew at an average seven percent. If we include 2017 and 2018, this would rise six-tenths of a point to 7.6 percent (Chart 4).
A lot is riding on 2018. How 4Q17 turns out may very well act as a window onto if the improvement seen in recent weeks is here to stay.
Thanks for reading!
