
 Equities are acting confused – almost schizophrenic – not able to make up mind whether they want to move up or down. They have been on a roller-coaster ride lately. An active trader could not be asking for a better trading environment, but for an average Joe, it is frustrating – particularly because things so far this year are polar opposite of how they transpired last year. Nearly four months into 2014, the S&P 500 is barely up for the year.
Typically, such lethargy can be construed as a sign that a change in trend is afoot, which for a five-year-old bull market could be equivalent to possibly being in a topping process. That could very well be happening, but we also know that this is no ordinary cycle. QE has the potential to continue to distort the way investors think and act. The so-called Bernanke – now Yellen – put is alive and well.
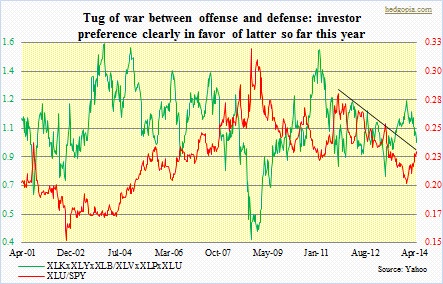
Nevertheless, underneath all this, there is some subtle change taking place. As 2014 began, investors have been gravitating toward defense more than offence. Risk-off is on. The chart above is simply a ratio of technology, materials, and consumer discretionary to healthcare, consumer staples, and utilities, and shows what investors are going for right now. The former is offensive, the latter defensive. Both XLU (utilities) and XLP (consumer staples) are at all-time highs.
As ‘defensives’ attract money, former favorites of the momentum crowd, such as bio-techs, social, and small-caps have been on the other end of the spectrum. Bio-techs and ‘social’ suffered a 25-percent thrashing in a month and a half beginning March – probably another sign the bull market is beginning to show its age. There is nervousness in the air. People are quick on the trigger.
Sure, this may be nothing more than a plain-vanilla rotation. But for that to be the case, we need new leaders.
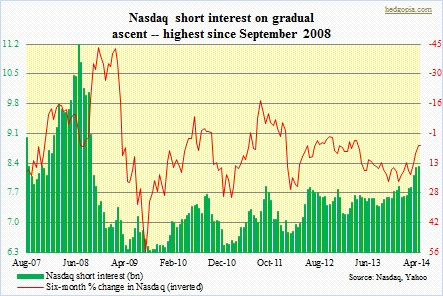 A lack thereof has the potential to prove the shorts that have been gradually adding to positions right. The accompanying chart shows Nasdaq short interest at its highest since September 2008 – means it is higher than in 2010, 2011 and 2012, each of which witnessed decent correction in equities. Short interest can prove tricky to use as a signal. Of course, if and when shorts begin to cover, it can put upward pressure on equities. On the other hand, shorts with high conviction can continue to press their case, by either staying put or adding further. Short interest on the Naz currently is what it was toward the end of 2007, and back then it continued to build until the mid-July peak the following year. Hence, if equity bulls are unable to force a squeeze right about now, odds are good that short interest will continue to rise, setting in motion downward momentum in equities.
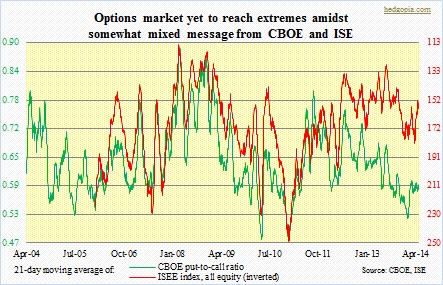 Over in the options market, the signal is no less blurry. As we can see in the chart, lately a slight divergence has developed between ISE and CBOE. At CBOE, a put-to-call reading in high-40s/low-50s has consistently been a signal of complacency among equity participants. In January this year, the ratio dropped to low 0.50s, and that was quickly followed by a six-percent drop in the SPX. Early March, the ratio was in high-50s; that is when the momo rout began. In contrast, ISE in the 130-140 range has been a good time to get constructive on equities. Current reading is 155. So CBOE is approaching a reading when it pays to be cautious, even as ISE is near a buy zone. Confusing!
No wonder markets cannot decide which way to go.
