- Amidst relentless rally, excessively bullish dollar sentiment
- R between U.S. exports and dollar weak, but continual strength can hurt exports
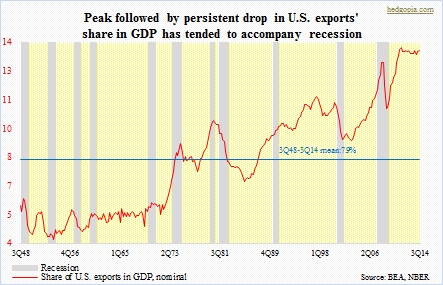
- Previously, recession has tagged along with persistent drop in ‘share of U.S. exports in nominal GDP’
Since it bottomed early May this year, the U.S. dollar has been in the midst of an unrelenting rally. In six months, the U.S. dollar index has risen nearly 12 percent. In the currency market, this is huge. In the process, several resistance levels have been taken out. Bullish sentiment is pervasive. The thesis goes something like this. The U.S. economy is strong, and getting stronger, even as its peers are struggling. Bond yields are higher for a reason versus, let us say, in the euro zone or Japan, with prospects of higher short-term interest rates next year. So there is nothing but blue skies ahead for the greenback. The sentiment is reflected in the futures market. By September 23rd, large speculators were net long 57k contracts in U.S. dollar index futures – an all-time high. They have cut those down to 43k (as of last week), but still lean heavily bullish. The index is bumping up against six-year-old resistance. 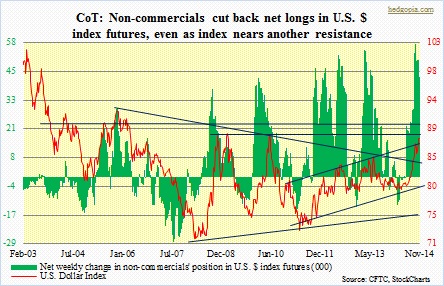
It will be huge if it can break out of the 88-88.50 resistance. Cogent arguments can be made for a stronger dollar long-term, but in the intermediate-term overly bullish sentiment can come in the way. But let us assume for a moment that the rally continues. How would that impact U.S. exports? A lower dollar makes exports cheaper, and vice versa. The dollar index peaked in July 2001 at 121, bottoming in April 2008 at 71. The past six years, it has gone sideways with higher lows. (Hence the importance of that 88-88.50 resistance.) In the chart below, negative correlation between U.S. exports and the greenback can be seen but it is not perfect. Back when the buck peaked in July 2001 the ratio of U.S. exports to imports stood at 0.73 (not shown here). By April 2008, this had dropped to 0.71. Despite persistent drop in the dollar, exports were weaker versus imports. After the dollar bottomed in April 2008, the ratio steadily rose – to all the way up to 0.84 in November last year (0.82 in September this year). Once again, exports grew even as the currency firmed up. 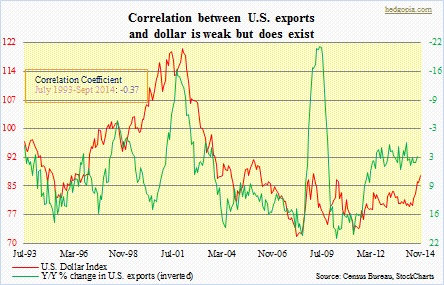
This probably explains why correlation between exports and the dollar is a rather weak -.37. Nonetheless, correlation is there. (Reason why the Bank of Japan is so hell-bent on driving the yen lower.) So if the dollar breakout is for real and years of firmness lie ahead of us, then we need to take a look at the chart below. In it, U.S. recessions have been plotted against the share of U.S. exports in nominal GDP. Exports’ share is at record territory, and for three years now it has gone sideways. Particularly considering that the global economy is anything but strong, the risk is to the downside. If the dollar continues to rally – and by default the euro and the yen weaken – it can act as a double whammy. It is only a matter of time before the red line begins to hook down. More often than not, post-World War II, that has been accompanied by recession. Something to watch.