
There was a bit of good news in pending home sales on Monday. The index jumped 3.5 percent month-over-month in February to 109.1 (Chart 1). This was the sharpest sequential increase in a year.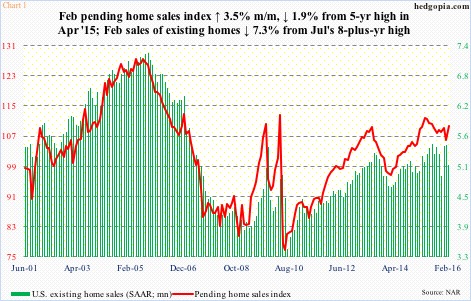 Pending home sales are based on contract signings, hence tend to lead existing home sales. In the current cycle, the former peaked last April at 111.2, followed by a peak in the latter in July at a seasonally adjusted annual rate of 5.48 million units.
In February, existing homes sales fell 7.1 percent m/m to 5.08 million units. The fresh uptick in pending home sales is a welcome sign. At least short-term. But is it long-term?
The possibility of firmness in sales – duration notwithstanding – comes amidst a slight retreat in price.
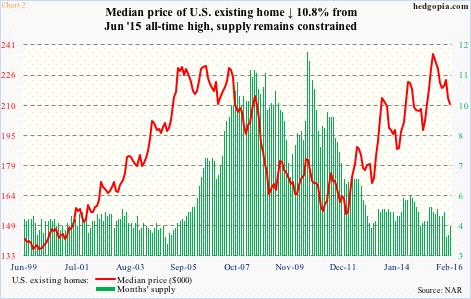 The median price of an existing home peaked last June at $236,300, easily surpassing the bubble high. As stated earlier, sales peaked the following month, and have dropped 7.3 percent since. Price has followed sales softness lower. At $210,800, February is down nearly 11 percent from the June 2015 high. This despite the fact that supply remains tight (Chart 2).
The dynamics between sales and price seem to be working perfectly.
That said, here is what could throw a money wrench into the equation.
As Chart 3 shows, post-bubble, home price has appreciated much faster relative to sales.
The excess is particularly evident in new home sales.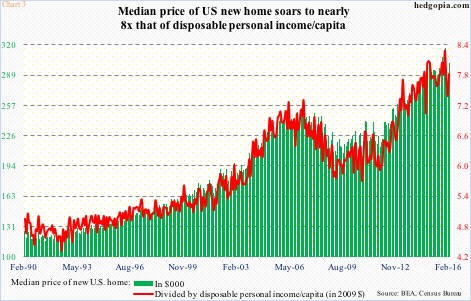 The median price of a new home surpassed the March 2007 bubble peak as early as February 2013, and continued making newer highs. The latest peak was recorded last November at $317,000, and has dropped 4.9 percent since.
Here is the real kicker. At that November peak, the price of a new home required 8.3 times disposable personal income/capita. February was down to 7.8x, but still higher than 7.3x when the median price peaked during the bubble.
In March 2007, disposable personal income/capita was $35,970, rising to $38,561 this February. Nonetheless, because price has risen faster, more income is needed.
This dynamic is in play even as household formation is once again losing momentum.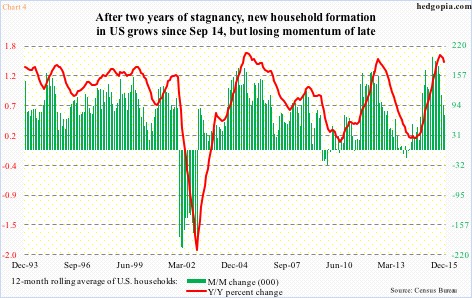 There were 117,707 households in December – the latest month for which data is available – essentially flat the past four months.
Beginning September 2012 through August 2014, there was a similar sideways action in household formation – around 115,000. Then in the next one year, households increased by north of two million. September through December last year, activity once again got stuck in the mud. This is a period in which non-farm payroll grew by an average of 249,000/month.
Chart 4 calculates a 12-month rolling average of households; at 117,163, December was a new high. However, m/m net change is rapidly decelerating, with y/y percent change rolling over.
This cannot possibly be good news for the green bars in Chart 1, if one has a horizon beyond just a few months.
The February jump in pending home sales tells us impending strength in sales of existing homes in the immediate future, but nothing longer-term.
For investment purposes, it is probably a good idea to fade this optimism.
ITB ($27.07), the iShares home construction ETF, has rallied nearly 26 percent since February 11, retaking both 50- and 200-day moving averages as well as $26 and change. The latter resistance goes back to May 2013 (Chart 5).
The six-week rally has pushed the ETF back into a range, the upper end of which lies around $28-29. If a breakout results, dynamics change, at least from housing stocks’ perspective.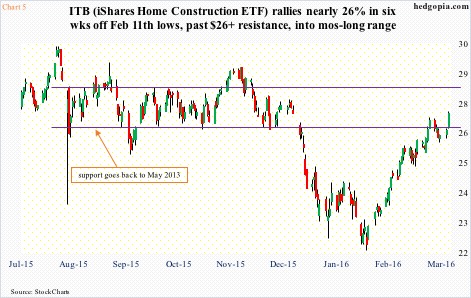
That said, depending on how it behaves near that resistance, it has potential to be a short candidate. It remains grossly overbought, but has momentum.
Wait and watch for now.
Thanks for reading!
