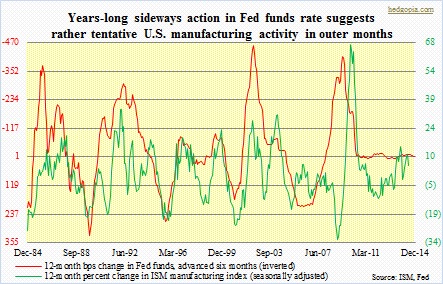
 The Institute for Supply Management’s monthly survey of economic activity in the U.S. manufacturing sector is one of the reliable indicators economists/market participants focus on. As with any other data point, it tends to correlate with other data points. The relationship could be leading, lagging or coincident. As can be imagined, it has strong correlation with change in the Fed funds rate. The relationship is simple. Interest rates are the price of money. If we cheapen the price, there will be more buyers, hence an increase in economic activity. Or that is how it is supposed to work. And it has. In the chart, 12-month change in the Fed funds rate has been advanced by six months, so it correlates well with 12-month percent change in the ISM index. As is natural, in a normal cycle, change in interest rates spurs change in economic activity. For instance, the rate dropped from 6.4 percent in December 2000 to 1.82 percent 12 months later, igniting a 24-percent year-over-year change in the ISM index in June 2002.
But the cycle we are in is anything but normal. Since the beginning of 2009, the Fed funds rate has pretty much gone sideways. And that is a problem. Yes, rates are at historic lows, but it cannot go any lower, which means the flat red line on the right side of the chart does not have the luxury of turning back up, which is what has been needed historically to further spur economic activity. This probably explains why the recovery has been so sub-par post-Great Recession and why the Fed-engineered ultra-low-interest-rate policy has failed to produce satisfactory results. In the current cycle, the ISM index has risen as high as 59.3 (February 2011) and dipped as low as 49.5 (November 2012). This has been such a narrow range versus past recoveries – (1) a high of 61.4 in May 2004 and a low of 46.1 in April 2003; (2) a high of 59.4 in October 1994 and a low of 42.8 in April 1991; and (3) a high of 69.9 in December 1983 and a low of 45.1 in August 1989.

