
The price-to-earnings ratio is probably the most commonly used tool in equity valuation. Within that, all too often, forward earnings are used. Trailing earnings are seldom employed.
In and of itself, in a normal cycle, there is nothing wrong with this approach.
Forward earnings are a better gauge of what is to come if earnings are stable – better yet, if they are being revised upward, as stocks will then have to play catch-up with earnings.
But what if earnings are being aggressively revised downward? Which is the case now. Should the focus instead be on trailing twelve months?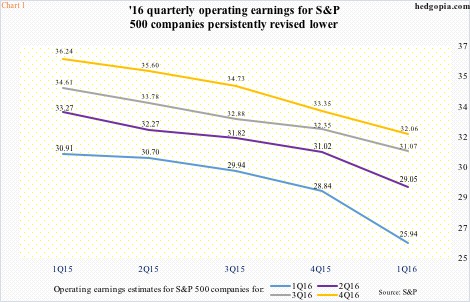 Take a look at Chart 1, which plots quarterly progression of operating earnings estimates for S&P 500 companies for 2016. For 1Q16, for instance, these companies were expected to earn $30.91 in 1Q15. A year later, by the end of 1Q16, estimates had dropped to $25.94.
The downward trend in earnings revision holds true for all four quarters this year. As a result, at the end of 4Q14, 2016 operating earnings estimates were $137.50, now they are $118.12.
This is not a new trend. Far from it. Earnings deceleration as well as downward revision in earnings have been going on for a while.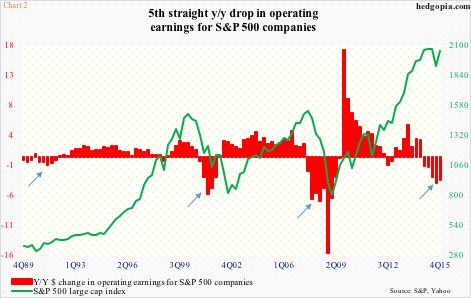 Operating earnings for S&P 500 companies peaked at 3Q14 at $29.60, sliding to $23.06 by 4Q15. On a 12-month rolling total basis, earnings peaked at 3Q14 at $114.51 and were $100.45 in 4Q15.
The red bars in Chart 2 represent year-over-year change in operating earnings for S&P 500 companies. The $4.16 drop in 3Q15 was the largest since decline of $6.51 in 1Q09. More important, earnings have dropped for five straight quarters.
During all three prior U.S. recessions, operating earnings have at least dropped for that duration (arrows). By that time, stocks had taken a sizable leg down. Not this time. The red bars and the green line in Chart 2 have decoupled.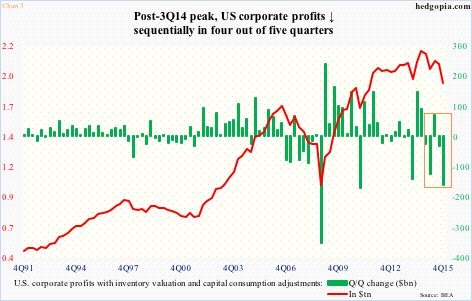 The extent of profit deceleration is also evident in Chart 3. U.S. corporate profits with inventory valuation and capital consumption adjustments came in at a seasonally adjusted annual rate of $1.89 trillion in 4Q15. They peaked at $2.16 trillion in 3Q14 – the same quarter operating earnings for S&P companies peaked.
Since profits peaked in 3Q14, they have declined sequentially in four out of the last five quarters (box in Chart 3). Further, on an annual basis they have dropped for two straight quarters – the first time this has happened post-Great Recession (not shown in the chart).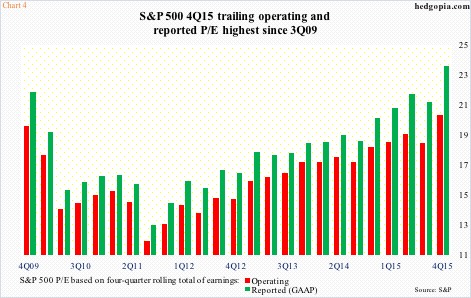 With this as a background, Chart 4 plots both reported and operating price-to-earnings ratio for the S&P 500 using trailing 12-month earnings, not forward. A couple of things jump out.
First, since 4Q15 in particular, the spread between GAAP and non-GAAP is widening. In 4Q15, this was 327 basis points – 23.6 GAAP and 20.3 non-GAAP. Normally, the higher the gap, the less reliable non-GAAP numbers.
Second, for both operating and reported, 4Q15 multiples were the highest since 3Q09. In other words, things are stretched. Multiples have come a long way since 3Q11 trough.
Of course, if we use forward earnings, multiples narrow to 17.3 (operating) and 18.4 (reported), but once again, how reliable are these estimates? They have not been for a while, as explained earlier. Trailing is what has already happened, hence a better guidepost in this environment.
Thanks for reading!
