
Gold peaked last August, before beginning a strong downtrend. Amidst this, gold bugs have put their foot down at dual support, rallying the metal the last two weeks. Important resistance lies ahead. Real yields likely come to gold’s aid in the weeks/months to come.
Gold is at an interesting juncture.
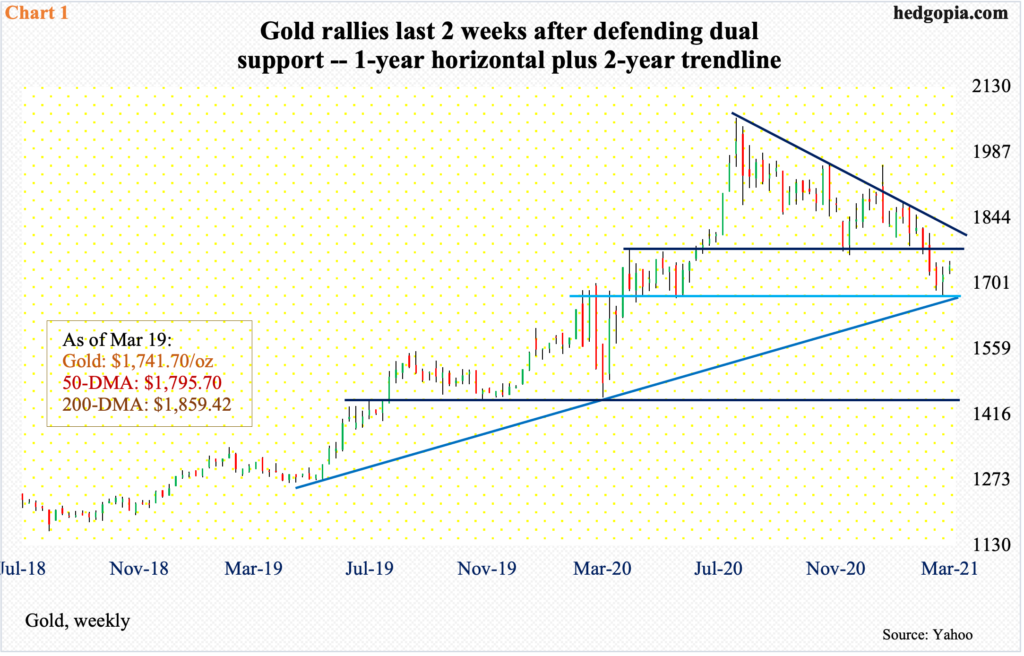
Although it reached an important bottom all the way back in December 2015, the metal began to genuinely lift off nearly two years ago. A rising trend line drawn from that low was defended a couple of weeks ago when gold tagged $1,673.30 intraday. This level also coincides with one-year horizontal support (Chart 1).
Gold has now rallied for two weeks back-to-back. This is potentially important as it preceded a persistent decline since it peaked at $2,089.20 on August 7 last year. From that high, the yellow metal made a series of lower highs within a descending triangle, which it fell out of late February when $1,760s-$1,770s gave way; should the pattern complete, gold could be eventually heading toward $1,440s. Hence the significance of gold bugs’ defense of the nearest support post-breakdown.
Last Thursday’s intraday high of $1,754.20 just about tested the underside of the descending triangle – unsuccessfully so far. But odds favor gold bugs in the weeks ahead, provided $1,670s remains intact.
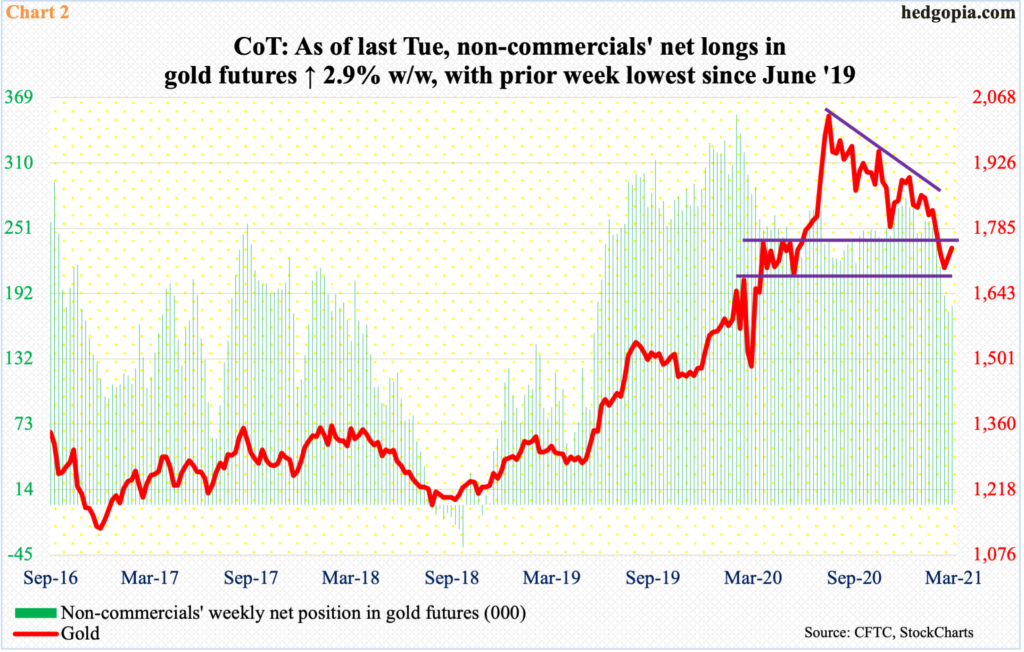
Last week (as of Tuesday), non-commercials added to their net longs in gold futures for the first time in seven weeks. They hold 180,196 contracts, with the prior week’s 175,163 contracts the lowest since June 2019 (Chart 2).
As a matter of fact, these traders have been cutting back for a while. Gold peaked last August but they began to reduce exposure mid-February after accumulating record 353,649 contracts. Their latest high was 279,318 contracts in the week to January 5. This was when gold bugs gave up trying to recapture $1,920s, which was the prior high from September 2011. On January 6 (this year), gold tagged $1,962.50 intraday but only to reverse hard and close at $1,908.60. By early February, the metal lost both the 50- and 200-day moving averages.
One week does not make a trend, but non-commercials’ action is worth watching, as more often than not the green bars and the red line in the chart tend to move hand in hand.
Also worth watching is how flows into GLD (SPDR Gold ETF) behave.
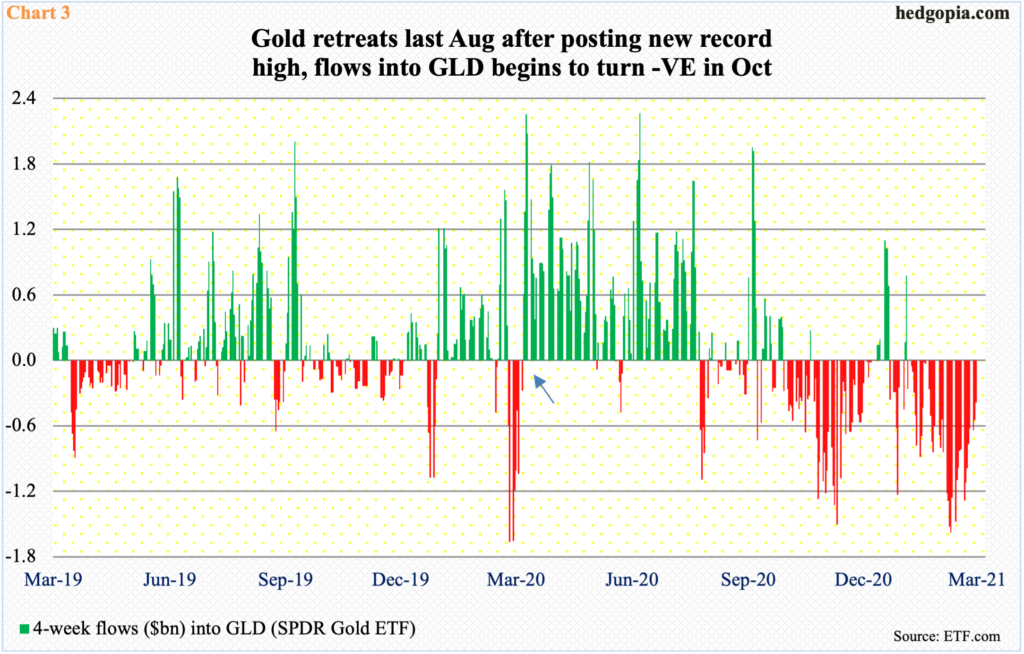
On March 16 last year, gold bottomed at $1,450.90 and went sideways until the 20th before it began to rally hard. This was also a time when equities and interest rates bottomed, with the S&P 500 large cap index bottoming on the 23rd and the 10-year treasury yield reaching 0.4 percent on the 9th. It was also on the 23rd when the Fed announced unlimited QE and said it would begin to buy investment-grade corporate bonds, which in April was expanded to also include junk bonds.
As gold began to rally, GLD flows persistently remained in the green (arrow in Chart 3). Then, come August, the four-week total began to turn red, which not only persisted but also got bigger.
From gold bugs’ perspective, the only consolation is that the outflows trend of late has improved. In the four weeks to last Wednesday, GLD lost $387 million – versus withdrawals of $1.6 billion in the week to February 25.
Amidst all this, depending on what transpires in the interest rate arena in the coming weeks could make or mar gold sentiment.
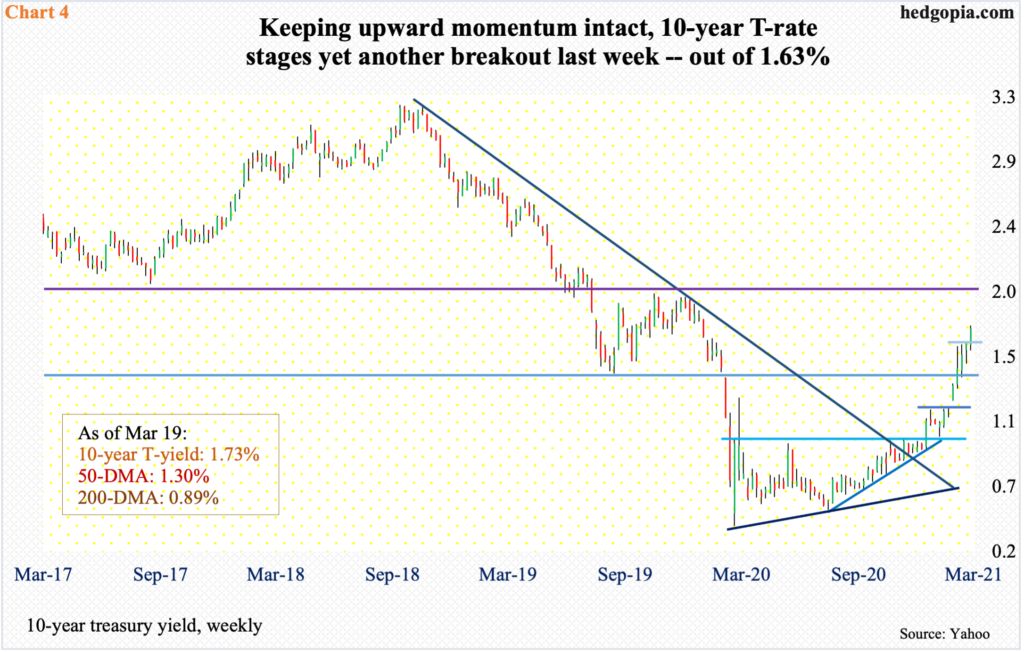
Rates on the long end of the treasury yield curve are perking up. Short rates are behaving, but the 10-year yield for instance has now rallied for eight weeks straight. Rates bottomed last March and gradually trended higher. In early January, the 10-year broke out of one percent, followed by 1.2 percent mid-February, 1.4 percent late that month and 1.63 percent last week (Chart 4).
Markets want the Fed to step in and stop the rout in long bonds – maybe some form of Operation Twist, in which the central bank buys on the long end and sells on the short end. But the Fed already spends up to $120 billion a month to purchase mortgage-backed securities and treasury notes and bonds. Last March, it held $4.2 trillion in assets, which have now grown to $7.7 trillion.
In the absence of Fed action, it is possible markets will continue to throw tantrums and the 10-year (1.73 percent) heads toward two percent. It is hard to say what the pain point is but at some point this will begin to matter in a leveraged economy, which will get hurt through higher interest cost (chart here).
The point is, at some point the selloff in bonds gets bad enough it will begin to attract investor interest. Concurrently, odds favor inflation rises in the months ahead. In the 12 months to January, core PCE – the Fed’s favorite measure of consumer inflation – increased 1.53 percent, up from 1.37 percent last November and 0.93 percent last April.
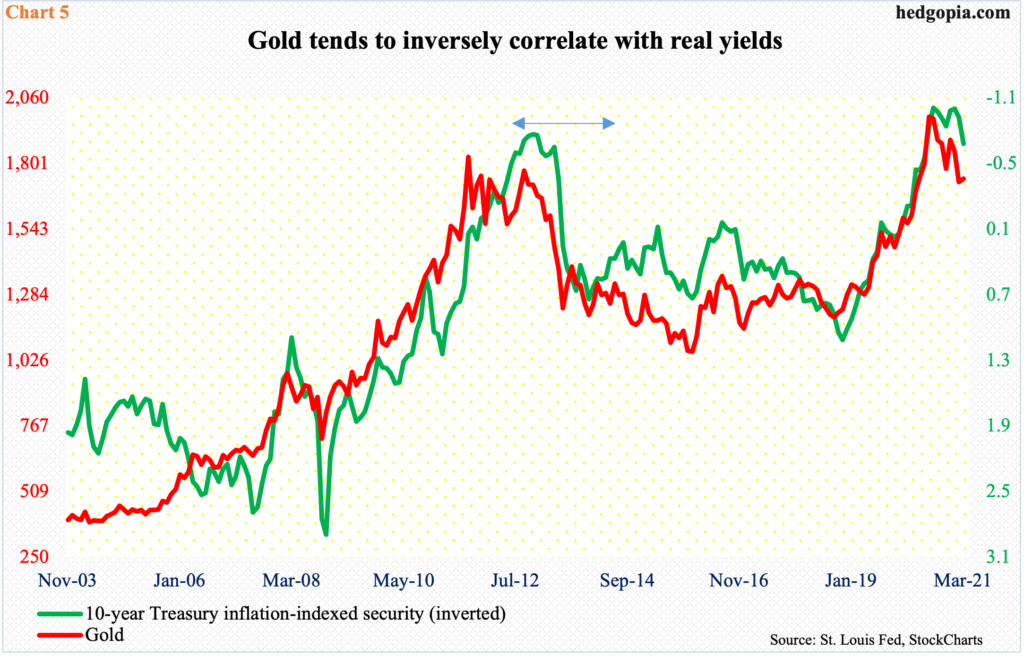
Real yields are a huge driver of gold prices. In Chart 5, the 10-year treasury inflation-indexed security (TIIS) is inverted and shows a tight relationship with gold. These are debt securities with coupon and principal payments indexed to inflation.
TIIS has been in negative territory since February last year. During last August when gold peaked, it yielded an average of just north of minus one percent. So far this month, it has averaged minus 68 basis points. This effective strength has hurt sentiment toward gold. A pickup in inflation, without a commensurate rise in nominal yields, is an antidote to this.
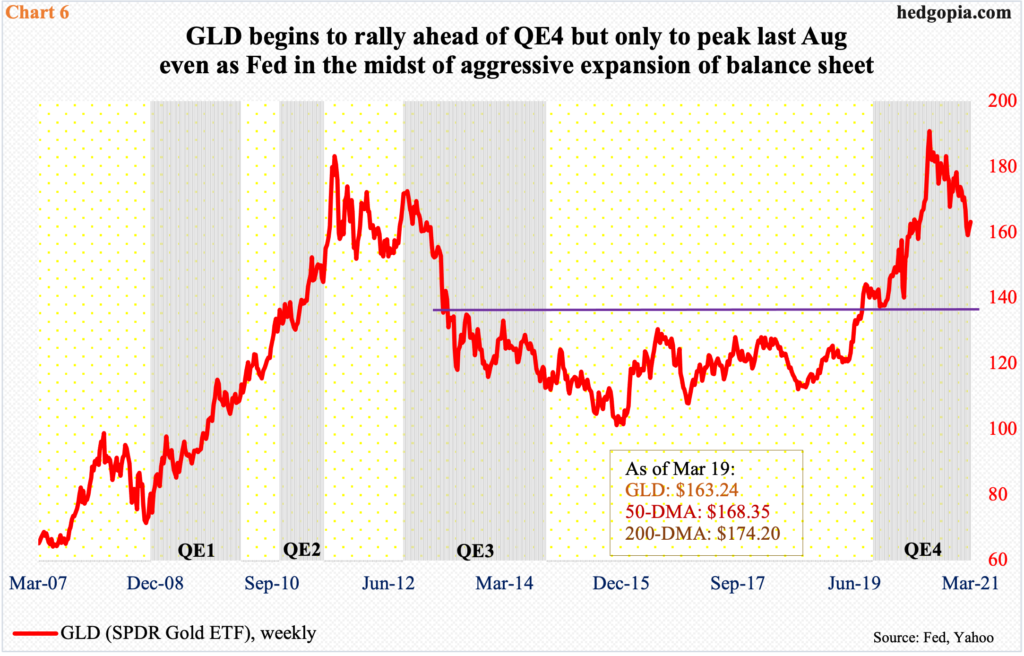
The thing is, gold rallied hard into and during the early months of the fourth iteration of quantitative easing (QE) but was not able keep up the momentum, as it followed real yields closer. Chart 6 uses GLD.
As explained earlier, the Fed set in motion unlimited QE a year ago, but its balance sheet began to expand as early as August 2019 when it held $3.6 trillion in assets. The metal acted similarly during QE3. As soon as QE2 ended, Gold/GLD peaked in September 2011 and was unable to rally during QE3, which lasted from September 2012 to October 2014. Once again, real yields rose during the period – from minus 71 basis points to plus 38 basis points, hurting gold (period indicated by two-sided arrow in Chart 5).
As things stand, gold is trading in sync with real yields. Defense of $1,670s is a sign the metal ($1,741.70) is beginning to price in a decline thereof in the weeks/months ahead. But there needs to be more. Recapturing of $1,760s-$1,770s can kick off a self-fulfilling prophecy. The corresponding level on GLD ($163.24) is $166.
Thanks for reading!
