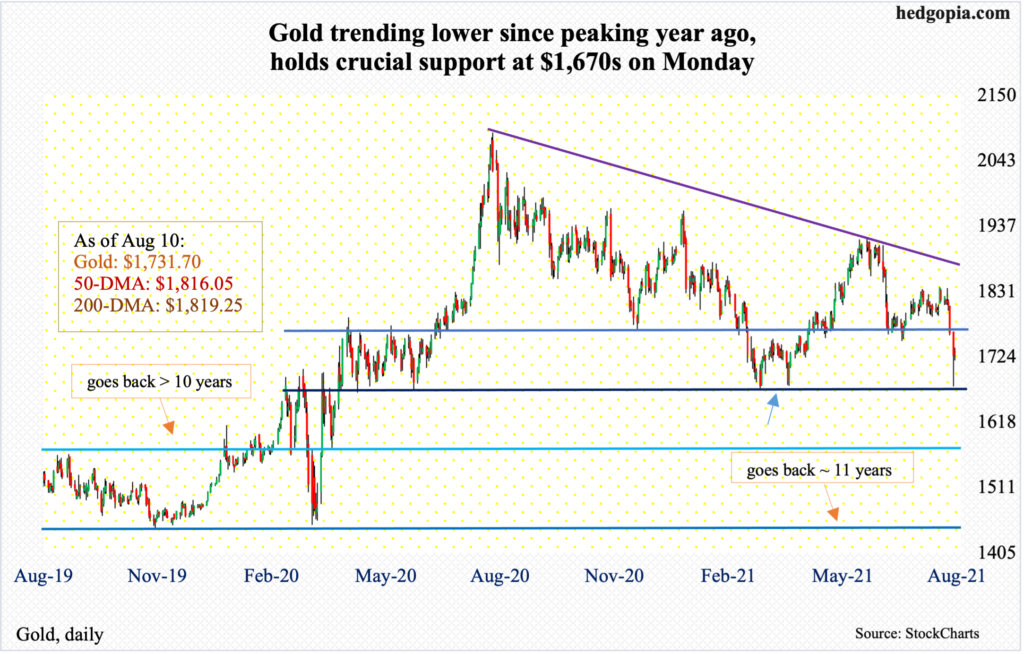
Gold in all probability successfully tested important support this week. On Monday, it dropped to $1,675.90 intraday but only to reverse sharply higher to close at $1,726.50, forming a potentially bullish hammer. In Tuesday’s long-legged doji session, the metal edged up 0.3 percent.
Support at $1,670s goes back to March last year. This week’s action precedes persistent downward pressure that lasted a year.
Gold reached an all-time high of $2,089.20 on August 7 last year. A couple of weeks before that, the yellow metal surpassed the prior high of $1,923.70 from September 2011. The momentum did not last.

In March (this year), gold found support at $1,670s (blue arrow in chart above). The subsequent rally was denied at $1,920s in June. Several times in the second half that month, gold bugs defended $1,760s-$1,770s, which continued to hold – until Monday when the metal sliced through this to test $1,670s.
Odds favor this holds – at least for now. A breach exposes gold ($1,731/ounce) to $1,560s and then $1,450s, both of whom go back more than a decade. But right here and now, risk-reward odds favor longs more than shorts.
Ahead, bulls and bears are likely to duel over control of $1,760s-$1,770s. On GLD (SPDR Gold ETF), this corresponds to $164-$165, with the ETF closing at $161.77 on Tuesday.
Thanks for reading!

