
- James Bullard’s recent dovish comments fail to ignite interest in gold
- Possibility of triple-bottom reversal, but needs confirmation
- With recent thrust waning, near-term bias is down
Since its peak in September 2011 at $1,924/ounce, gold has been trapped in a bear market. As is true with any other asset class, it has had its share of bear rallies, some of them strong. In the 12 sessions ended October 21st, the metal increased six-plus percent. Nothing in a big scheme of things, but the bounce was important as it came off of important support. Buying ahead of the Indian Diwali festival probably helped. The momentum seems to be stalling. Rather discouragingly from the perspective of gold bugs, gold was lower last Friday from October 16th when James Bullard, in an interview with Bloomberg TV, talked about the possibility of delaying the end of the Fed’s bond buying. Not too long ago, he was talking about a rate hike. This about face from a hawk-turned-dove should have potentially ignited interest of people who worry about inflation caused by central-bank money-printing in gold. Stocks rallied, gold did not. But then again, it has been a while the yellow metal has not responded to this signal anyway. Gold peaked three years ago as the Fed’s bond-buying paused post-QE2. Late 2012, QE3 was rolled out, but gold failed to catch a bid. Or, maybe it was simply forecasting – it turns out, correctly – that runaway inflation in consumer prices was not in the cards. 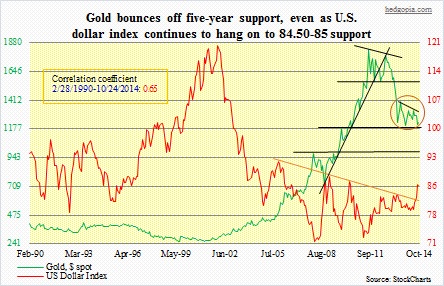
It is too soon to say if the current waning in momentum is short- or intermediate-term. Encouragingly, the metal has gone sideways for over a year in what looks like a triple bottom. The crucial 1180 level has held. Some important moving averages are no longer pointing down. So far so good. Once confirmed, triple bottom usually marks an intermediate- or long-term change in trend. If it is a genuine bottom, upside targets are galore. Just to throw out some numbers. Fibonacci followers, for instance, would be targeting 1464, 1550 and 1640. These are 38.2-, 50- and 61.8-percent retracement levels, respectively, of the 1924-1179 decline. But there is a big hurdle ahead before these Fib numbers even come into focus. For confirmation of triple bottom, the price needs to break above resistance at around 1400. Volume has not really surged off the third bottom. And there is resistance around 1325, which is where gold will break out of the one-year-plus sideways pattern (brown-circled in chart on top). 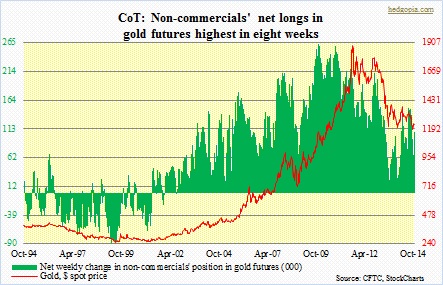
Interestingly, as shown in the first chart, between September 2011 and May 2012 post-peak, a similar reversal pattern formed around 1525, but gold could not break out of the neckline. The subsequent decline pushed the metal all the way down to 1179. So it is possible gold (1231) breaks down below that 1180 support. We simply do not know which way it is going to break. One wild card is the U.S. dollar. A strengthening greenback has put pressure on commodities. The currency had a multi-year breakout in July, and there is currently widespread optimism that the buck would continue to rally. Technicals are grossly overbought. If price closes near current levels, October would have signaled an even duel between bulls and bears. It is not clear the recent breakout is continuation or reversal of the prior trend, which was of course down. Hence from a contrarian perspective it does not hurt having an open mind about the dollar’s recent breakout. A weak dollar helps the yellow metal. Once again, it is too soon to say whether or not the dollar breakout is genuine. Hence the limbo that gold is in. Going by how large speculators are positioning themselves in the futures market, it might break in gold’s favor. Last week, their net longs in gold futures rose to an eight-week high.
For now, though, short-term technicals are suggesting the path of least resistance is probably down.
