
US consumer spending is holding up, even as manufacturing is under tremendous pressure. Consumers have been dipping into savings owed to loads of government stimulus post-Covid. Bank deposits remain healthy but at the same time the rate of change year-over-year is in deceleration. At some point, the Covid savings will no longer act as a tailwind, and consumers will hunker down.
In January, US retail sales jumped three percent month-over-month to a seasonally adjusted annual rate (SAAR) of $697 billion – a new high. Except for housing, consumer spending for the most part is pressing on.
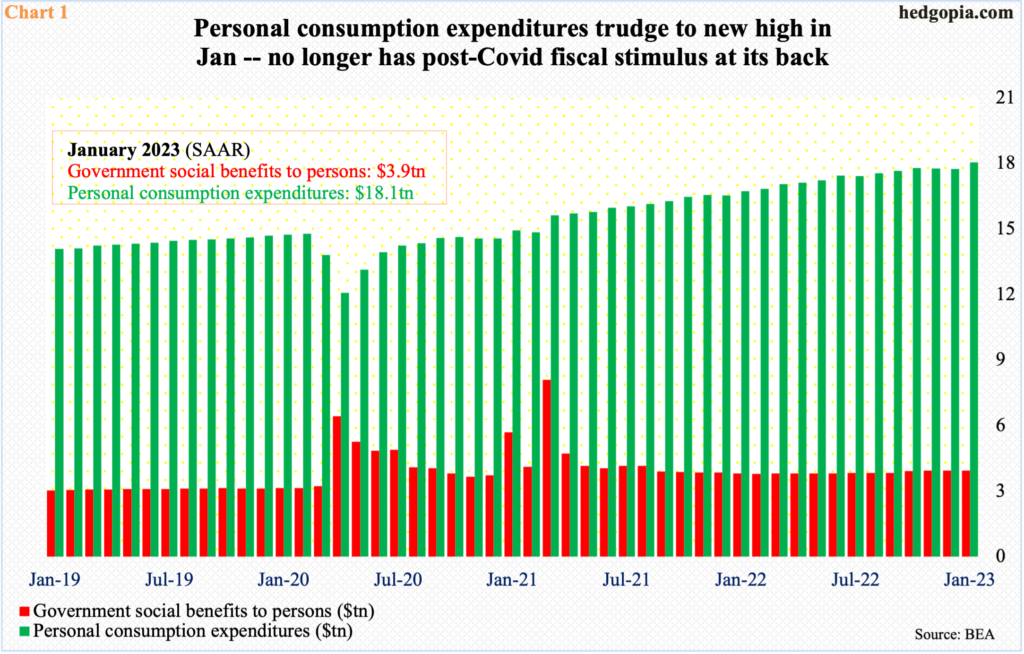
Personal consumption expenditures in January increased 1.8 percent m/m to $18.1 trillion (SAAR) – also a new high. Post-Covid, in April 2020, this had dropped to as low as $12.1 trillion. By then, the Covid stimulus was already on its way. ‘Government social benefits to persons’ doubled from $3.2 trillion (SAAR) in March that year to $6.4 trillion in April, followed by $5.3 trillion in May; it was not until October that year this line item went back below $4 trillion, which come 2021 again surged – $5.7 trillion in January and $8.1 trillion in March. The red bars in Chart 1 are now back to their normal trend, but the above-mentioned spikes were a big help in buttressing consumers’ balance sheets.
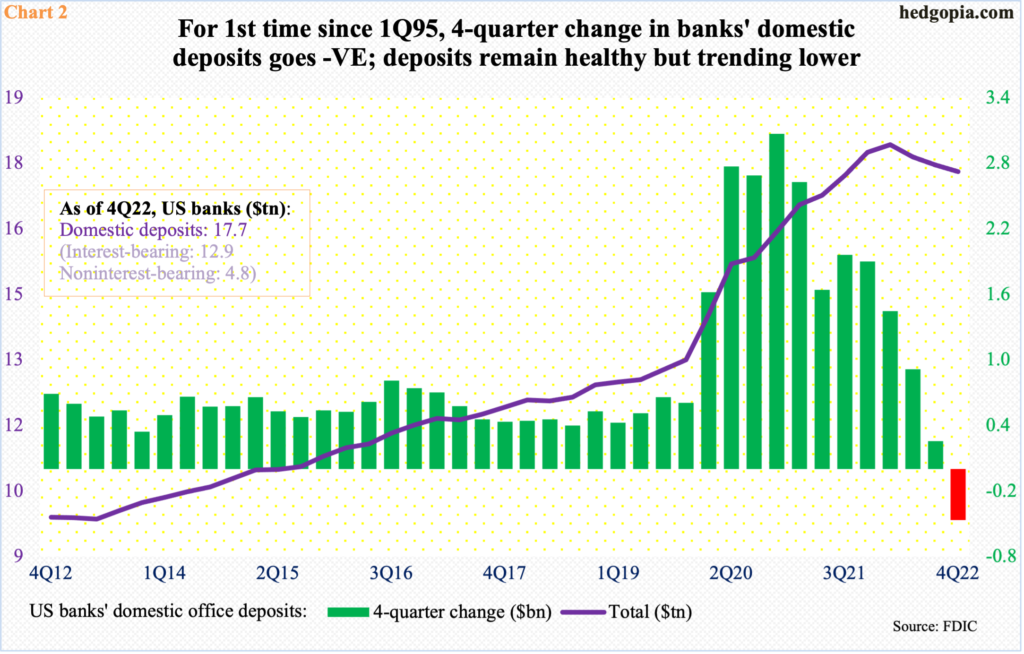
In keeping with the Covid-induced stimulus, US banks’ domestic office deposits began to go vertical in 1Q20 (Chart 2). In 4Q19, they were $13.2 trillion, rising to $14.3 trillion in the following quarter and subsequently peaking at $18.4 trillion in 1Q22. In 4Q22, deposits were $17.7 trillion. Since the 1Q22 peak, they have dropped in every quarter.
Here is the thing. Deposits remain healthy. There is still a ton consumers can fall back on. That said, the year-over-year rate of change is now a headwind. In fact, for the first time since 1Q95, the four-quarter change went negative in the last quarter.
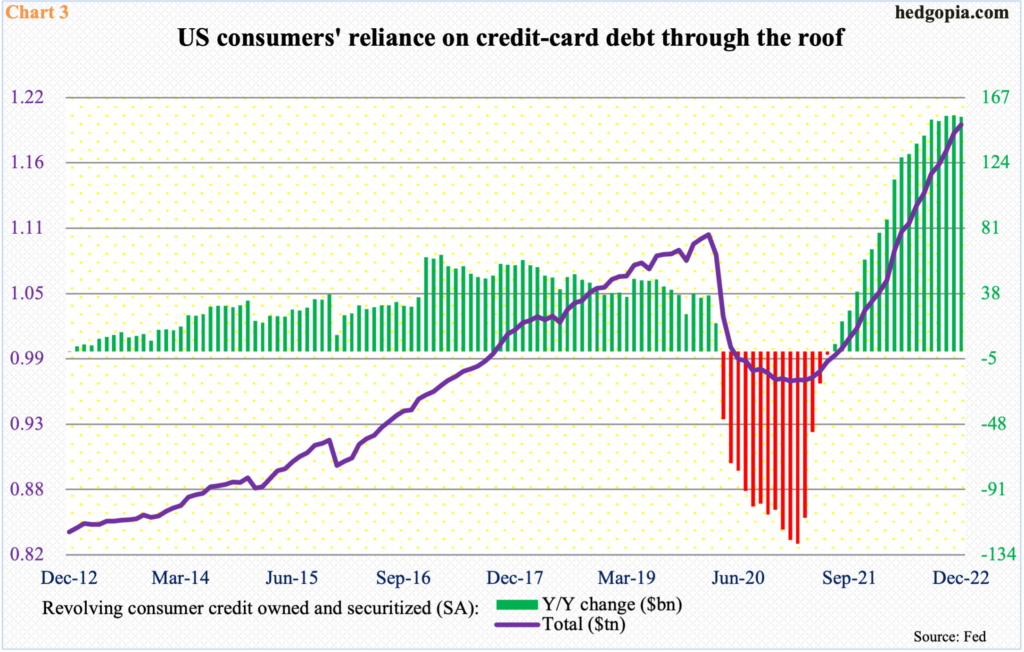
This is taking place even as consumers continue to load up on credit. Their fascination with revolving credit, which is a committed loan facility allowing a borrower to borrow up to a limit, knows no bounds. Credit cards are the best example.
Last December, revolving consumer credit stood at $1.2 trillion – a fresh high. This was up $154.3 billion from last year. The y/y rate of change went positive in July 2021 and then went parabolic. In the three months through December, the green bars in Chart 3 have gone flattish but they have done so at a very elevated level.
Consumers are levering up at a wrong time.
Interest rates have trended higher. The 10-year treasury yield closed Thursday at 4.07 percent, the 30-year fixed mortgage rate at 7.10 percent and the bank prime rate at 7.75 percent.
They have all tracked the benchmark rates higher. The fed funds rate has gone from a range of zero to 25 basis points last March to the current 450 basis points to 475 basis points and is still headed higher.
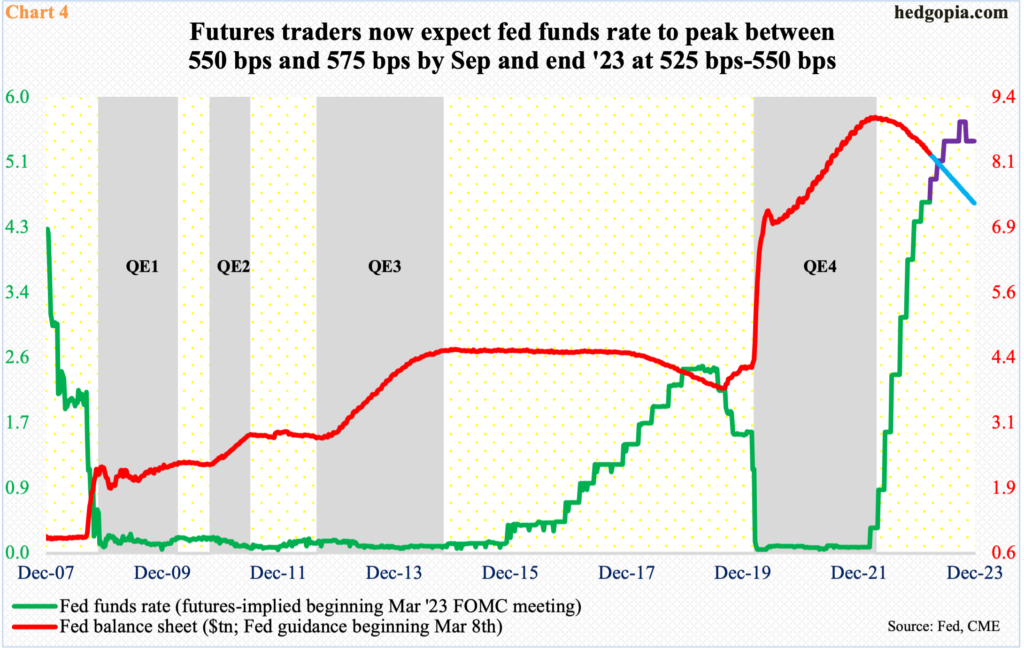
In the futures market currently, traders have priced in a peak in the fed funds rate between 550 basis points and 575 basis points by September this year. Their rates outlook was revised higher after last Friday’s PCE inflation for January. Before January’s CPI (consumer price index) was reported on February 14, they expected the fed funds rate to peak south of five percent and that the Fed would ease twice in 25-basis-point increments in the latter months this year. In the wake of last Friday’s PCE report, their expectations for a terminal rate have gone up but continue to expect a 25-basis-point drop, which is expected to occur in November (Chart 4).
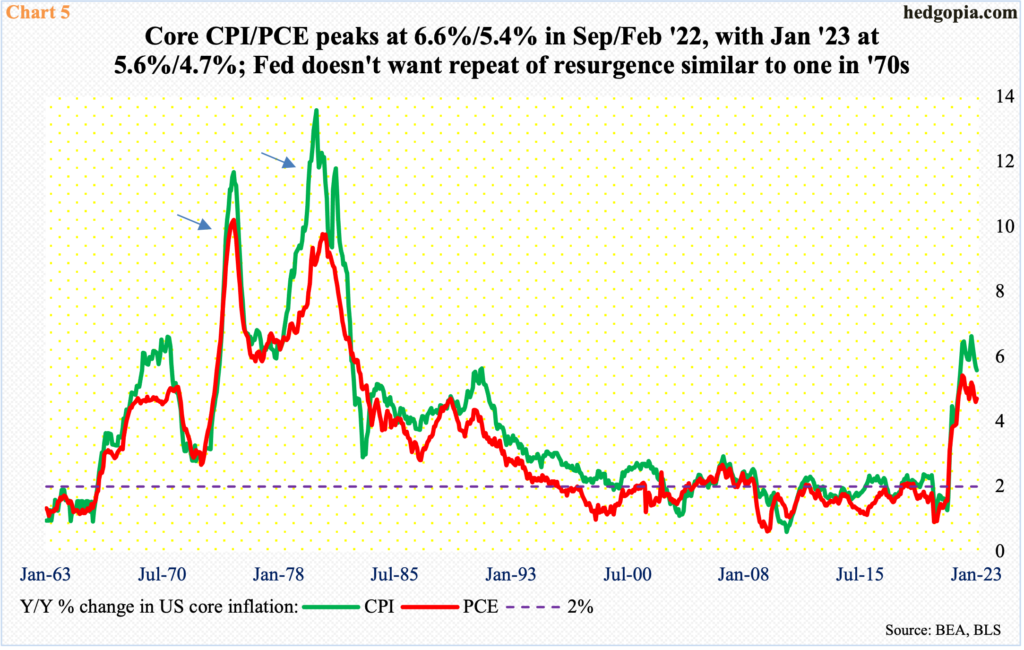
Importantly, given the current trend in inflation, which is proving to be sticky, the Fed likely leaves the benchmark rates at an elevated level longer than currently priced in. The central bank would not want a repeat of the kind of resurgence witnessed in the ’70s (arrows in Chart 5).
In the 12 months to January, headline and core PCE grew 5.4 percent and 4.7 percent respectively; this follows a 5.3- and 4.6-percent rise in December. January’s uptick ended a downward trend intact since last October. The two metrics respectively peaked last year in June and February at seven percent and 5.4 percent.
This comes in the wake of a similar hotter-than-expected CPI report. In the 12 months to January, headline and core CPI increased 6.4 percent and 5.6 percent, having respectively peaked last year at 9.1 percent in June and 6.6 percent in September.
The Fed, which has a two-percent goal on core PCE, has no option than to stay tight – until the economy meaningfully decelerates and inflation’s back is broken. For that, consumer spending needs to get hurt. The higher interest rates will have achieved this in due course, although consumers are yet to feel the real impact as they are still sitting on tons of Covid savings, which are being gradually run off.
The upside of lower consumer spending is that it will help bring inflation down. The downside is that this will hurt the economy, which at this point the Fed would not mind engineering.
Thanks for reading!
