
CNBC.com ran an interesting story last Thursday (March 3rd) on resurging home flipping in the U.S. Turns out, according to RealtyTrac, nearly 180,000 family homes and condos were flipped in 2015, making up 5.5 percent of all sales. This was the first increase in the flip share after four years of shrinking.
An interesting tidbit, but with potentially huge repercussions for housing down the line.
Apparently, home flipping was a positive factor in sales last year, as well as in prices. Incremental demand must have put upward pressure in both.
For flippers, price appreciation is key. It is their oxygen, and there was plenty of it last year.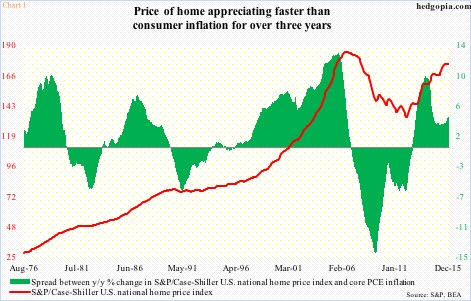
In Chart 1, the green bars represent inflation-adjusted price appreciation on a year-over-year basis using the S&P/Case-Shiller U.S. national home price index and core personal consumption expenditures (PCE) inflation.
On a real basis, price has been appreciating faster than inflation for over three years now. The spread was 4.02 percent last December, up from 2.93 in February. Nominally, home price rose at an annual rate of 5.4 percent last December, up from 4.3 percent in February.
What has caused this upward pressure on prices? Primarily supply (Chart 2).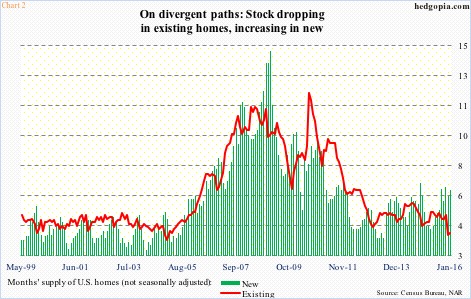
The sharp spike, followed by an equally sharp collapse, in the middle of that chart was a byproduct of the housing bubble. Supply of homes (not seasonally adjusted) has been moving up and down along a more normal path now, with normal ups and downs. And the two are on diverging paths currently.
Supply of existing homes stood at four months in January, versus 5.2 last April. Between the periods, supply of new homes has gone up from 4.2 to 6.4 months. On the right side of Chart 2, the bunch of green bars in the six-month range for the past five months is easily noticeable.
In the meantime, sales are beginning to diverge as well. In January, sales of new homes reached a seasonally adjusted annual rate of 494,000 units, essentially flat with 495,000 in December 2014. Between the periods, sales of existing homes rose from 5.07 million (SAAR) to 5.47 million.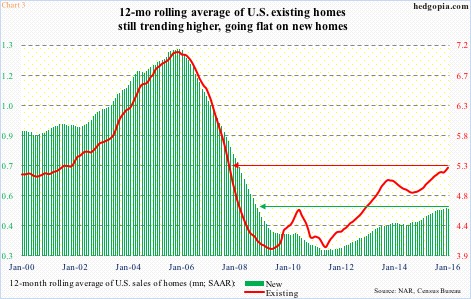
Month-to-month obviously tends to be volatile. So Chart 3 focuses on 12-month moving average of both existing and new homes. The uptrend continues on existing, with 5.28 million in January the highest since 5.37 million in October 2007. In new homes, the 503,000 last December was the highest since 502,000 in November 2008. But here is the thing. January slowed to 500,000; plus, August through November last year were all in the 490,000 range. Momentum in new homes is in deceleration.
What could have caused this?
Sales are nowhere near bubble days, but prices of both existing and new homes already managed to exceed the prior peaks.
The median price of a new home peaked in March 2007 at $262,600, which was surpassed in February 2013. The uptrend, however, continued – until it peaked at $307,600 last September. January was $278,800 (Chart 4).
On the existing front, price peaked at $230,400 in July 2006. That peak was surpassed last June, when it reached $236,300. Since the June peak, however, price has been weakening, with January at $213,800.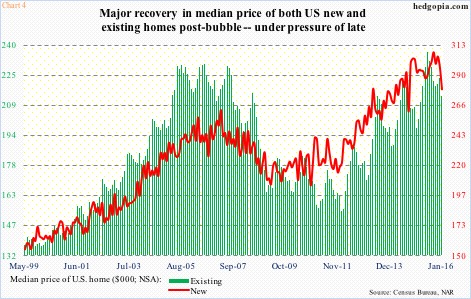
Evidently, if we use bubble highs as a reference point, price appreciation has been much sharper in new homes versus existing. Plus, the first time price (new homes) crossed the $300,000 mark was in November 2014 and remained elevated until the September peak. This has clearly impacted sales (Chart 3).
Therein lies the danger.
The prevailing trend of sharp price appreciation is not sustainable. In due course, sales get adversely impacted, which, in turn, will end up hurting price. As Chart 2 shows, supply of new homes is beginning to rise in new homes.
Home flipping is another variable in all this. As long as price appreciation is larger than the cost of capital, flippers are in it. Once that stops, and the trade is no longer profitable, they are out. And with that a reliable source of demand. Looking at both Charts 3 and 4, it is just a matter of when, not if, when that happens.
Thanks for reading!
