
In an otherwise lackluster post-Great Recession recovery, housing has provided decent support to the U.S. economy. The only question is durability – or a lack thereof.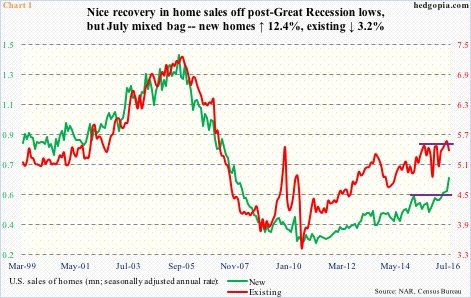
Off post-bubble lows, sales of existing homes increased from a seasonally adjusted annual rate of 3.45 million units in July 2010 to 5.39 million in July this year, and new homes from a seasonally adjusted annual rate of 270,000 in February 2011 to 654,000 (Chart 1).
In new homes, July this year was the highest since October 2007, and in existing, the 5.47-million units in June this year was the highest since February 2007. Sales diverged in July, with new homes surging 12.4 percent month-over-month and existing falling 3.2 percent m/m.
If there is one consistency in U.S. housing, it is the persistent increase in home prices.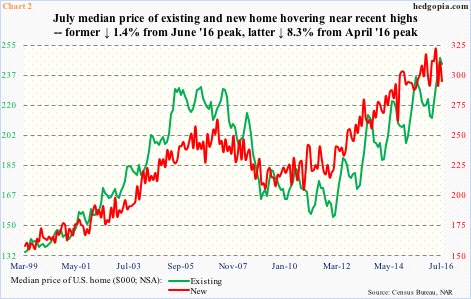
Unlike sales that are substantially off 2005 all-time highs (Chart 1), median home prices surpassed bubble highs a long time ago, and continued higher, with existing rising to $247,600 in June and new to $321,300 in April this year (Chart 2). Supply constraints have helped.
In July, months’ supply (not seasonally adjusted) was 4.7 for existing homes, and 4.1 for new ones. These are low readings, helping price appreciate much faster than would probably make sense, given income growth in particular.
At least on one metric, price rise has reached a dangerous level.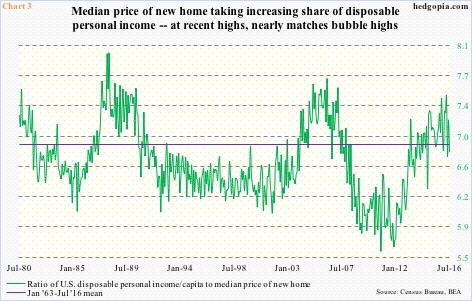
Chart 3 calculates a ratio of U.S. disposable personal income per capita to median price of new home. In July, the former was $43,362 and the latter $294,600, for a ratio of 6.79. Most recently, the ratio peaked at 7.48 in April this year.
Post-Great Recession, the green line in Chart 3 bottomed at 5.59 in October 2010. Since then, disposable personal income has grown 18.6 percent, and the price of a new home 44.3 percent. Consequently, buying a new home increasingly takes a larger share of disposable personal income. The April 2016 high was the highest since the 7.7 10 years ago. Those were the bubble days.
Of course, when we factor in the prevailing ultra-low mortgage rates, Chart 3 looks like a moot point. But should it?
Mortgage rates are low, and have been a tailwind for housing. But households have other debt as well … credit cards, auto loans, student loans, you name it.
Back in June 2009, when Great Recession ended, consumer credit was $2.59 trillion, and stood at $3.63 trillion in June this year. During the period, student loans grew from $710.9 billion to $1.36 trillion, and auto loans from $742 billion to $1.07 trillion.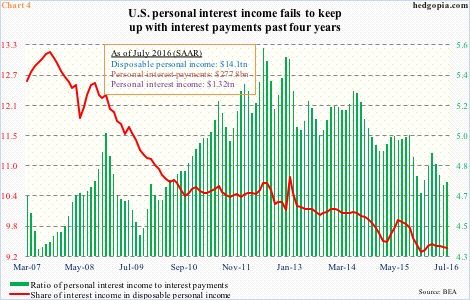
Once again, going back to June 2009, personal interest payments were $277.6 billion, versus $277.8 billion in July this year – flat as a pancake. During the period, interest income rose from $1.28 trillion to $1.32 trillion. This is a healthy combo. But these dynamics changed four years ago.
Interest payments bottomed at $235 billion in June 2012, and began to rise; interest income was $1.31 trillion back then and evidently has not grown much. The mismatch is reflected in the persistently dropping green bars in Chart 4. Interest income’s decreasing contribution toward disposable personal income is portrayed by the red line.
The point is, yes, we are in the midst of zero interest-rate policy, helping credit grow, but it also hurts the savers. In the aggregate, low mortgage rates help housing, but not necessarily the overall dynamics between interest income and interest payments. And definitely not the rapid price appreciation.
Thanks for reading!
