
The 1Q16 earnings season is upon us. So far, of the major names, Alcoa (AA) was a thumbs down, JP Morgan (JPM) a thumbs up. At least that was the verdict of the market.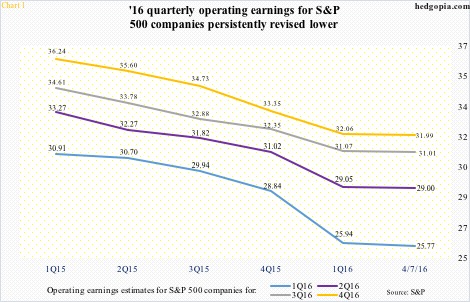
In general, the bar for the first quarter continues lower. At the end of March, S&P 500 companies were expected to earn $25.94 out of operations. A week later – as of April 7th – this went down by 17 more cents. Go back to the end of March of last year, 1Q16 estimates were as high as $30.91.
Chart 1 shows how quarterly operating earnings estimates for S&P 500 companies this year progressed from 1Q15 to now. The trend is down in all four.
In the end, the green line in Chart 2 will probably once again come in around the high 60s. That is the percent of S&P 500 companies that beat estimates. The red represents those that missed, and the indigo those that met.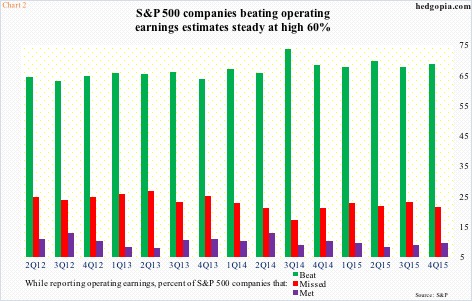
All the three bars in Chart 2 look consistently similar. The chart only goes back to 2Q12, but on average 70 percent of the companies beat estimates. Companies obviously would like to beat when they report, even as analysts want access. The outcome is constant massaging of the numbers just so the former are able to beat/meet.
As time has gone by, companies are understanding this game better.
Chart 3 shows the progression of changes in operating earnings estimates for 2015, 2016 as well as 2017. A couple of things jump out.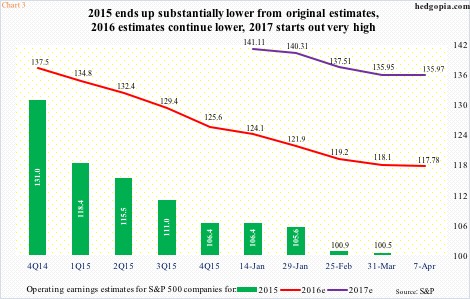
First off, the direction is down in all three. At the beginning, estimates start out very optimistic, and the air gradually comes out as the year progresses.
At the end of 2Q14, 2015 estimates were $137.50. When it was all said and done, earnings came in at $100.45. Incidentally, in February last year, 2016 was expected to bring in $137.50 as well. Since then, the red line in Chart 3 continued lower, now $117.78. In the middle of January this year, 2017 estimates were introduced, and they were $141.11, now $135.97.
Throughout 2015 in particular, the beat rate was consistent: 1Q15, 67.7 percent; 2Q15, 69.8 percent; 3Q15, 67.9 percent; and 4Q15, 68.8 percent.
As estimates get revised lower, it gets easier to beat. 1Q16 should not be an exception in this regard.
Here is the thing. Even though 2016 is 14 percent lower from the original estimates, as Chart 1 shows, the trend is still down.
That said, if the consensus is right, 2016 would be a special year.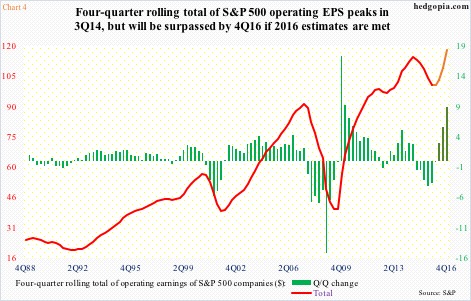
On a four-quarter rolling total basis, operating earnings peaked in 3Q14 at $114.51, declining to $100.45 by 4Q15. Sequentially, earnings have dropped for five straight quarters.
In Chart 4, the red line represents the actual numbers, while the orange line on the right side of the chart, representing four quarters this year, are based on estimates. The same applies to the green versus dark green bars, with the latter based on estimates.
If 2016 estimates are met, the afore-mentioned 3Q14 peak in operating earnings gets surpassed. By the end of the year, the four-quarter rolling total would come in at $117.77, surpassing the prior peak of $114.51. The green/dark green bars, too, would reverse a six-quarter straight decline, and into positive territory.
A perfect world, if it comes to pass, but it is hard to remain oblivious to an entrenched trend – the trend evident in Charts 1 and 3. The optimistic hook higher in both the orange line and the dark green bars in Chart 4 may turn out to be just that – optimistic.
Thanks for reading!
