Inflation is all the focus right now – for the central bank, for stocks and for the average household. The Fed is tightening and wants to see consumer inflation make a dash toward its two percent target. There are incipient signs both CPI and PCE are in the process of peaking. This could eventually have repercussions for all kinds of assets, including equities.
Of its dual mandate of maximum employment and price stability, the Federal Reserve is laser-focused on the latter currently. There was a time when in the wake of Covid-19 and the recession it caused, it immersed the system in liquidity, which, along with fiscal stimulus, greatly contributed to the pricing pressure of today that the Fed is trying hard to stamp out.
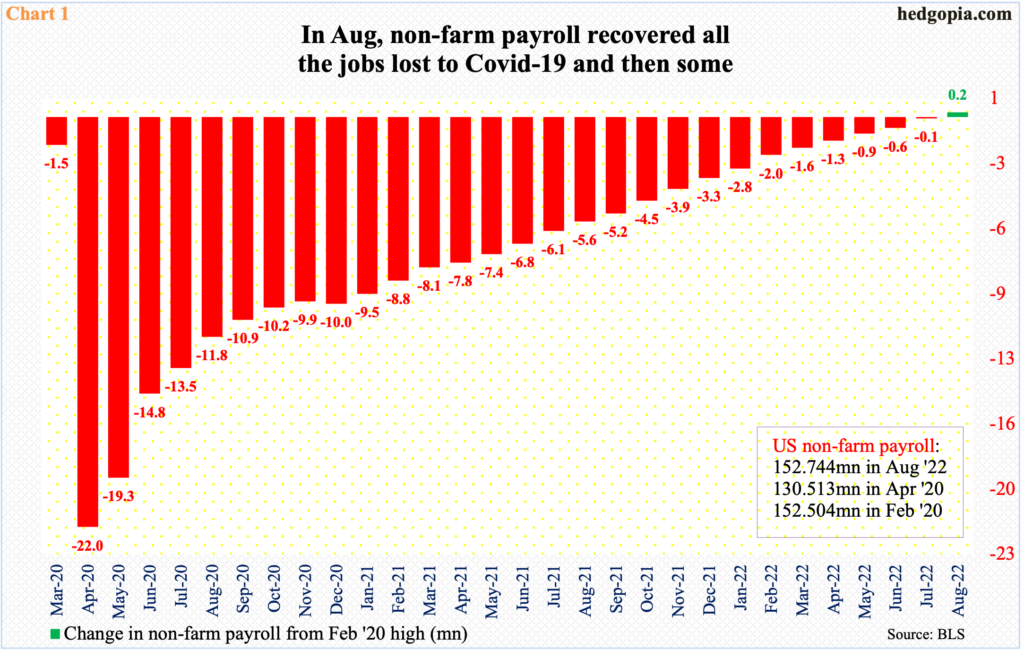
Back in 2020, the economy took a nose-dive in such a speed that it lost 22 million non-farm jobs in just a couple of months – 130.5 million in April versus 152.5 million in February. It was only in August (this year) that the economy recovered all those jobs, and then some, when non-farm jobs tallied 152.7 million, exceeding the pre-pandemic high by 240,000 (Chart 1).
The cost to all this is inflation.
In the latter months of 2019, consumer inflation was averaging one to two percent, with the PCE (personal consumption expenditures) index rising 1.6 percent in the 12 months to December and the CPI (consumer price index) increasing 2.3 percent. Then the virus hit. The economy came to a standstill. Inflation was barely positive.
In May 2020, headline CPI grew 0.1 percent year-over-year; one month earlier, headline PCE increased 0.4 percent. It turns out they were the lows of the cycle. As both fiscal and monetary stimulus flooded in, pricing pressure began to gradually build and then accelerate.
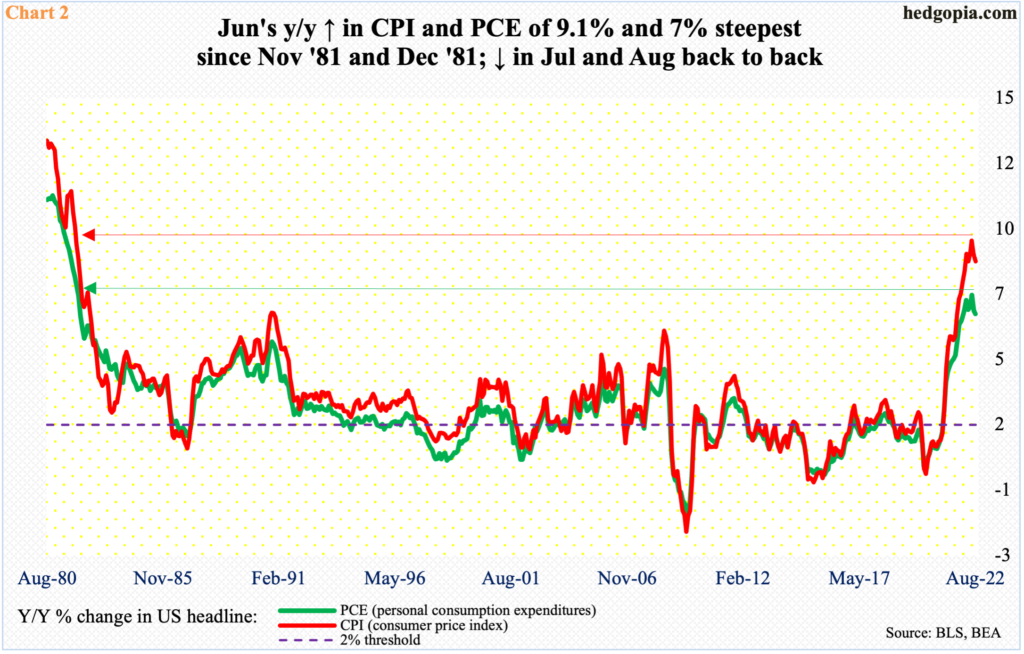
In December 2020, headline CPI and PCE were rising at a y/y rate of 1.4 percent and 1.3 percent respectively. A year later, they were galloping ahead at seven percent and six percent; come June (this year), this was 9.1 percent and seven percent, which was the steepest pace since November and December 1981 (Chart 2).
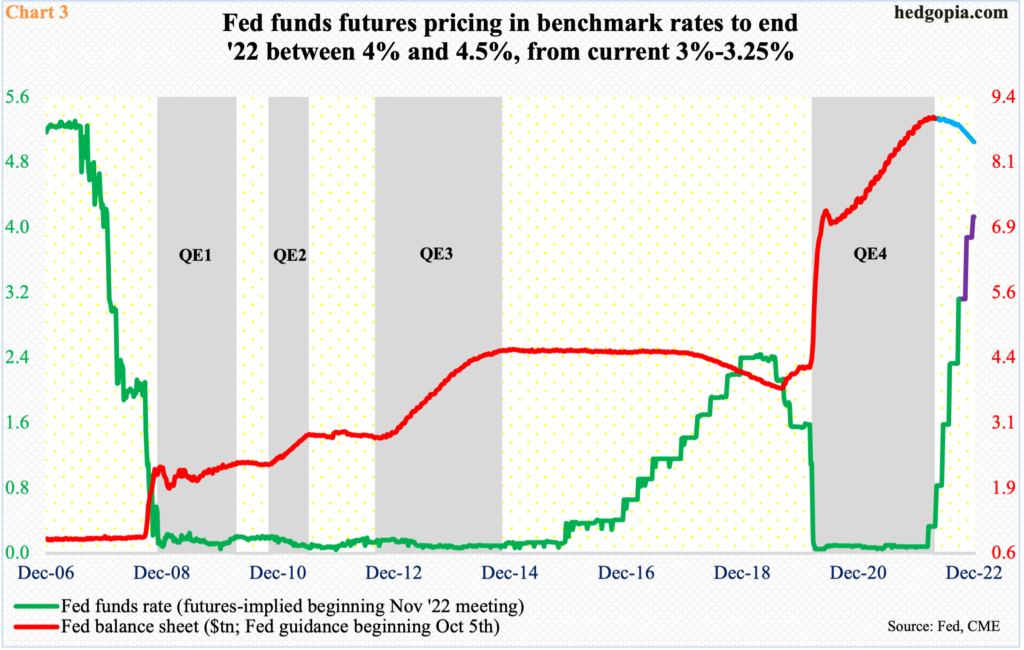
The Fed, which initially ignored the incipient inflation saying it was “transitory,” has woken up. The fed funds rate, once left zero-bound between zero and 25 basis points for a long time, has been raised to a range of 300 basis points to 325 basis points. There is more in store.
There are two more meetings left this year – November 1-2 and December 13-14. Until a week ago, futures traders heavily favored a 75-basis-point move in November and a 50 in December, ending the year between 425 basis points and 450 basis points.
Last week, their expectations moderated a bit. For November, they are now split between a 50 and a 75. December is the same way; earlier, a 50 was priced in, but now traders are not sure if this is going to be a 50 or a 75. In essence, 2022 is set to end between either 400 basis points and 425 basis points or between 425 basis points and 450 basis points (Chart 3).
The Fed concurrently is reducing the balance sheet, which – currently $8.8 trillion – more than doubled from $4.24 trillion in early March 2020 to $8.97 trillion this April.
Tighter monetary conditions will have an impact on economic activity, and by default on inflation, sooner or later. It is just a matter of how tight things will need to be.
The 300-basis-point rise in the benchmark rates to date is probably not done filtering through the economy in its entirety. Besides, conditions will get tighter.
Arguably, there are signs of softness in pricing pressure.
Headline inflation peaked in June (Chart 2). After the 9.1-percent print in that month, CPI grew 8.5 percent and 8.3 percent in July and August respectively. Similarly, PCE decelerated from seven percent in June to 6.4 percent in July and 6.2 percent in August.
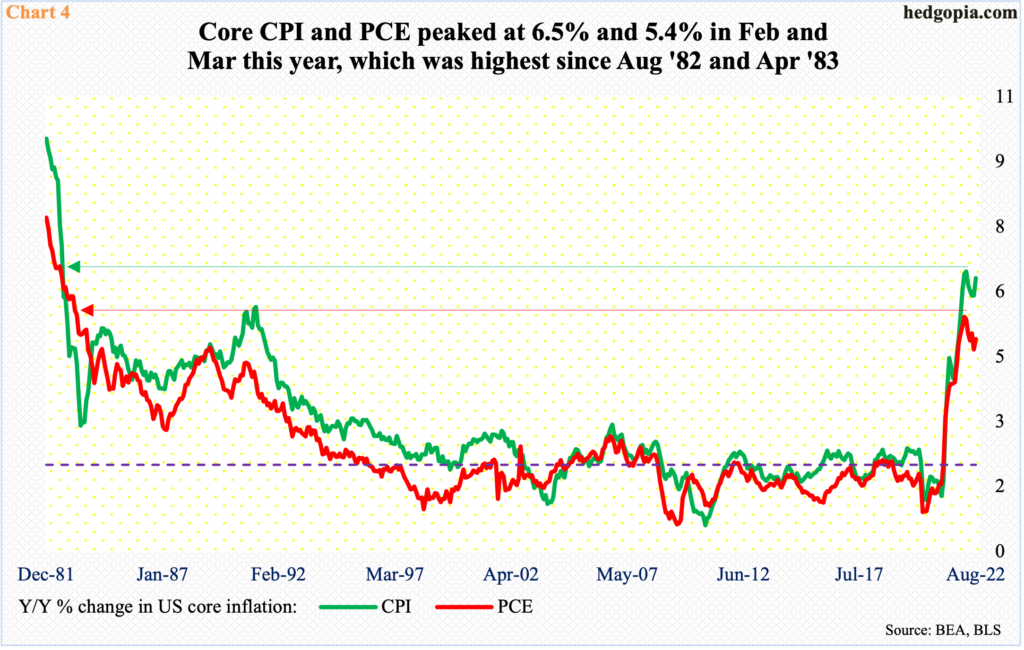
Even in core, there is some softness. Core PCE peaked at 5.4 percent y/y in February, while core CPI’s high was registered a month later at 6.5 percent. In August, they respectively came in at 4.9 percent and 6.3 percent, having risen from July’s 4.7 percent and 5.9 percent (Chart 4).
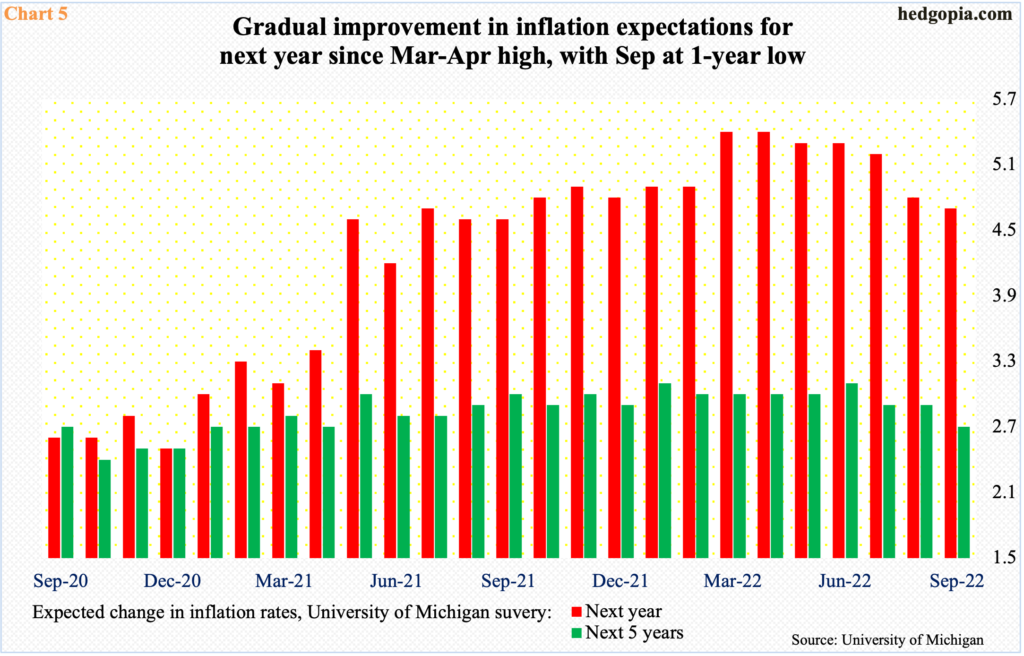
The possible declining trend is also evident in the University of Michigan’s survey of inflation expectations.
The expected change in inflation rates next year hit a high of 5.4 percent in both March and April this year; last month, it came in at 4.7 percent. For the next five years, a high of 3.1 percent was recorded in January this year, which was again hit in June; last month, it stood at 2.7 percent (Chart 5).
The point in all this is, yes, the Fed is in tightening mode, and inflation is rampant. Amidst this, some signs of softness are appearing in both actual and survey data. If the trend continues, risk assets, including stocks, should inflate.
Thanks for reading!

