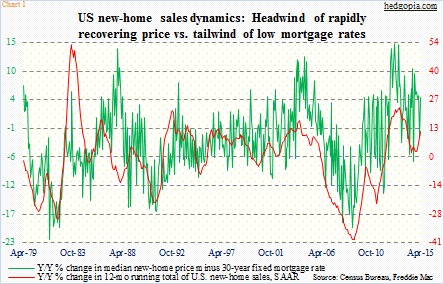
Sales of U.S. new homes came in better than expected in April, up 6.8 percent month-over-month to a seasonally adjusted annual rate of 517,000. Monthly numbers tend to be volatile. The 12-month rolling total was 5.66 million in the month – the highest since December 2008; year-over-year, it grew 11.8 percent, versus 2.1-percent growth last November (Chart 1). The trend is going the right direction. So it seems.
But that is not the impression you get looking at homebuilder stocks this morning. ITB, the iShares home construction ETF, is in the red. As I am writing this, it was trading at 26.85, down 0.6 percent.
Last week, existing home sales for April were weaker than expected, as they dropped 3.3 percent m/m to an annualized rate of 5.04 million. This was on the 21st. The ETF had already started to come under pressure by then, and the sluggish April sales obviously did not help.
Fast-forward to today, and you would think the ETF would have rallied on news of new-home sales. But it has not. One possible reason is, it is reacting to technicals at the moment. Daily momentum indicators have turned lower.
And then there is this issue of price again.
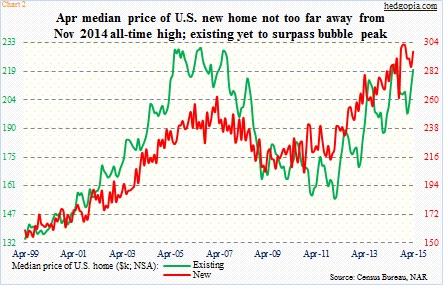
In April, the median price of a new home rose 4.1 percent m/m to $297,300; y/y, it is up 8.3 percent. With this, the price is a stone’s throw away from the November 2014 all-time high of $302,700. Prices of both new and existing homes have seen quite a recovery, although the latter is yet to surpass the bubble high (Chart 2).
If these prices stick, this has to negatively impact sales in the future. Given the state of the economy and the lack of progress in wage growth, housing needs a goldilocks scenario – a steady rise in both sales and price. The latter is growing way too fast – much faster than growth in incomes.
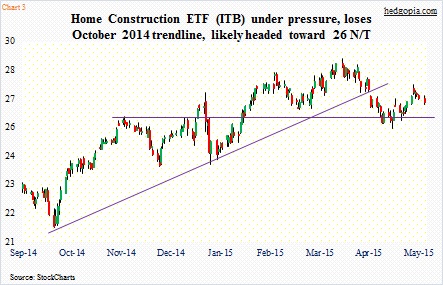
It is possible this is what is reflected in ITB’s inability to favorably react to the news this morning. The 26 support continues to be crucial, and likely comes into play sooner than later (Chart 3).
Thanks for reading!

