
- BLS’ January oil-and-gas-extraction data gives false sense of security
- Challenger survey shows 20k energy job-cuts in Jan, more than in all of 2014
- Boom bust normal in U.S. oil patch, but shale boom of last five years like no other
U.S. oil-and-extraction jobs dipped slightly in January, down 1.9k, to 199.5k. The high in the current cycle was recorded this past October at 201.5k, so merely 2k jobs have been lost since. A blip in the big scheme of things, considering the collapse in crude oil. Support jobs in December, as a matter of fact, matched September’s all-time high of 337.6k (Chart 1).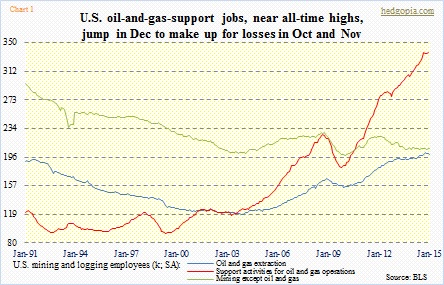
But the reality could not be further from the truth.
Challenger, Gray & Christmas informs us that in the energy sector there were no hiring plans announced in January, as well as December. In all of 2014, 2.2k hiring plans were announced. Overall for the economy, January saw 53k job-cut announcements, up from 32.6k in December. Of this, 20.2k were in the energy sector – 38 percent of the total – and was more than what was announced in all of last year. In 2014, 14.3k job cuts were announced in energy, versus 17.8k in 2013.
The January spike in energy job cuts compares to 2.8k month-over-month and a mere 413 year-over-year. Texas probably bore the brunt of this as 19.9 cuts were out of that state. Here is probably the most revealing nugget out of that survey. A total of 21.3k jobs were cut citing oil prices. Remember, 20.2k job cuts were announced in the energy sector. So 1.1k oil-related cuts have taken place outside the energy sector. And we are advised not to fear contagion!
The Bureau of Labor Statistics data for January does not reflect all this. It is clear these layoff announcements have not been acted upon yet. It is coming.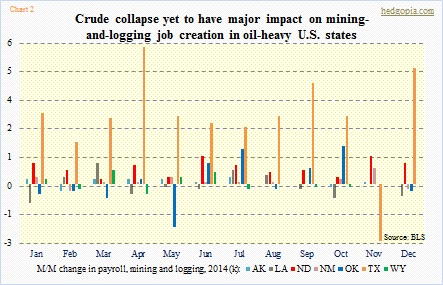
In fact, if we just focus on mining and logging payroll in seven oil-heavy states, there is not much change in the overall picture whatsoever (Chart 2). In reality, Texas reversed November’s 2.4k decline and went on to add 4.9k in December. These are mining and logging jobs, which means jobs related to coal and such would also be included, but it helps us gain insight into what is going on.
The only question is how the charts above might look like in months to come. As of January, there were 199.5k people working in oil and gas extraction, and another 337.6k in support jobs (latter as of December). This has more than doubled in the past decade. That is how torrid the growth rate has been. As can be seen on Chart 1, it started going parabolic beginning late 2009/early 2010. This is all because of the shale revolution.
The U.S. oil industry has been through many ups and downs.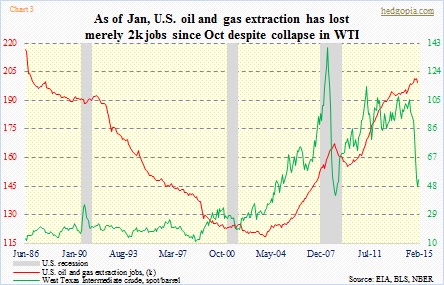
Back in 2008, the West Texas Intermediate crude peaked at $147 in July, oil-and-gas-extraction jobs did so in December at 167.1k (Chart 3). Crude bottomed in February 2009 at $34; jobs bottomed at 155.3k in December that year. From peak to trough, jobs dropped seven percent. Support jobs peaked in September 2008 at 226.2k and troughed at 182.2k in October 2009.
In October 2000, the WTI peaked at $37 and troughed in November 2011 at $17. Oil-and-extraction jobs had already been declining, and kept declining until December 2003. Support jobs peaked at 125.6k in July 2001 and more or less went sideways until April 2003 before surging higher (Chart 1).
The point is, it is difficult to look at past cycles and judge what awaits the nation’s oil patch in terms of job losses. But to get an idea about how fast-money was chasing the shale boom of the last five years, here is one data point. Until they peaked in September last year (at 1,931), rig counts went up 120 percent from June-2009 lows. The WTI traded around $70 back then and rose all the way up to $115 in 2011. None of those projects probably came online assuming a price in the $40s and $50s.
