
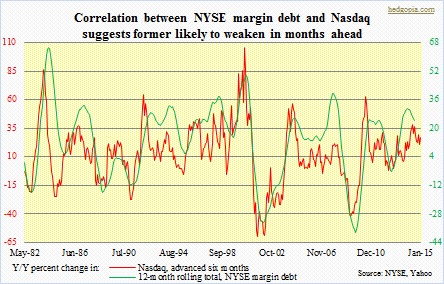
 NYSE margin debt was essentially flat in July – $460.2bn, down from $464.3bn in June and not too far away from February’s all-time high of $465.7bn. It is possible August manages a month-over-month increase; numbers will be released in a month. In the wake of the recent two-week decline, equities bottomed early August and have since rallied rather strongly. In an environment where other sources of buying power are more or less absent – weak/stagnant wage growth, bonds continuing to attract investor money, money-market funds having already shrunk by $135bn (to $2.58tn) year-to-date, low savings rate (5.3 percent in June), among others – margin debt has proven to be an important source of liquidity. Back in July 2007, it peaked at $381.4bn and bottomed out at $173.3bn in February 2009. Concurrently, equities peaked in October 2007 and found a trough in March 2009. Since that trough until the February high, margin debt grew 169 percent, versus 200 percent appreciation in the S&P 500 Index. Regardless August sees m/m increase or decrease, if the correlation between the two components in the adjacent chart is maintained, then margin debt is set to decline in the outer months.
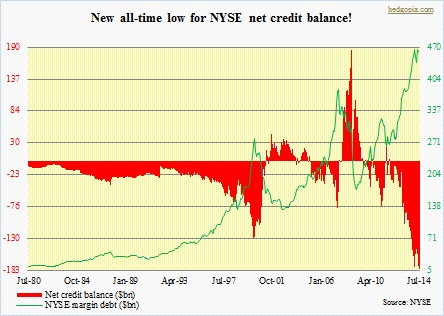 In this scenario, only a sustained drop in margin debt has the potential to trigger a self-fulfilling prophecy. A shallow correction in equities, like the one we just witnessed, will not do so. After the February high, margin debt fell in both March and April, by a cumulative $29bn, stabilized in May and shot up $26bn in June. On the other hand, in April 2010 it peaked at $261.9bn and then dropped 12 percent in the next two months; in April that same year, the S&P 500 Index suffered a three-month, 17-percent drop. In 2011, margin debt peaked at $320.7bn in April and went on to lose 18 percent by September. In May of that year, the S&P 500 Index began correcting and gave back 22 percent in the next five months. In this respect, it is too soon to declare if the February high is an important top in margin debt. What we do know is that it is way extended. Net credit balance (calculated as ‘free credit cash accounts’ plus ‘credit balances in margin accounts’ minus ‘debit balances in margin accounts’), also known as investor net worth, is a record -$182.1bn. That is how stretched things are. Once it begins to unravel, the process has the potential to be a messy one.
