
Orders activity in manufacturing have snapped back with a V shape. But this recovery is not uniformly seen across the economy. Orders for non-defense capital goods ex-aircraft dropped y/y in March through June; in past recessions, the decline has been steeper both in terms of duration and magnitude.
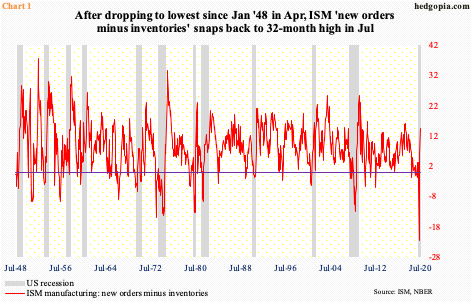
Several US data points have snapped back from the March-April swoon. From April’s 11-year low of 41.5, the ISM manufacturing index rose the next three months to July’s 54.2, which is a 16-month high.
Similarly, the new orders sub-index was down to 27.1 in April, which was the lowest since December 2008. By July, it printed 61.5 – a 22-month high. Concurrently, inventories fell between April and July, from 49.7 to 47.
As a result, the spread between orders and inventories rose to a 32-month high in July. Before this, April’s reading was the lowest going back to January 1948 (that is how far back this series goes).
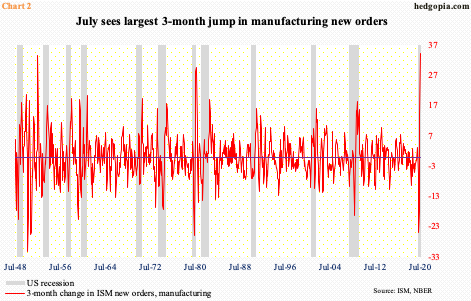
The magnitude by which orders improved can be seen in Chart 2. Between April and July, it shot up 34.4 points, which is the largest three-month change ever (at least going back to January 1948). The closest was 33.6 points 68 years ago.
Just based on this metric, it is a V – a V-shaped recovery, that is. But the strength is not uniformly distributed across multiple data sets.
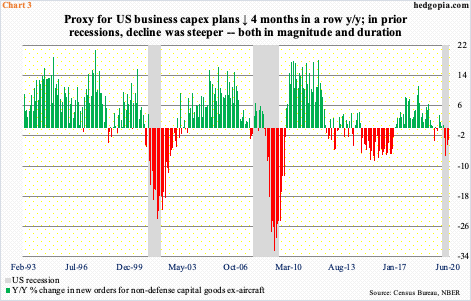
Orders for non-defense capital goods ex-aircraft – proxy for business capex plans – dropped 3.2 percent year-over-year in June to a seasonally adjusted annual rate of $64.3 billion. In April, orders were $61.3 billion.
June’s y/y drop was the fourth in a row. Versus the last two recessions, this pales in comparison in terms of both magnitude and duration. In fact, the red bars in Chart 3 looked worse even during the economic slowdown of 2015/2016.
The Covid-19 recession is six months old. Unless it is different this time, this series in all likelihood is nowhere near taking on a V shape.
Thanks for reading!
