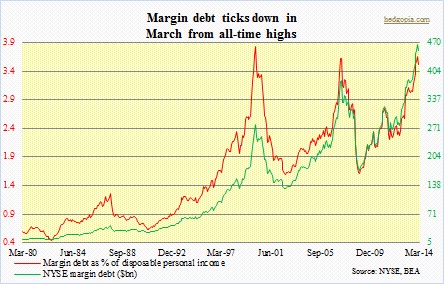
 NYSE margin debt declined slightly to $450.3bn in March from February’s all-time high of $465.7bn. This is a minor drop, but going by the two major previous peaks this millennium, this has the potential to be an important reversal in trend. It is too soon to declare that, of course. Central-bank activism – particularly in the U.S., Eurozone and Japan – continues to distort how investors view/avoid risk.
Nevertheless, trees do not grow to the sky. The more this metric – or any other metric, for that matter – gets extended, the reversal can be as painful.
Back in 2000, margin debt peaked in March at $278bn, coinciding with the 1553 peak in that month in the S&P 500. In 2007, it peaked in July at $381.4bn. That month, the SPX made a new high of 1556 and then retreated. The index went on to exceed that high by 20 more points in October of that year, and then we know the rest. Stocks fell off the precipice.
As the chart above shows, the higher they soar, the harder they drop, when that eventual drop comes. The math is simple. When margin debt is as extended as it is now – or as it was back in 2000 and 2007 – as equities come under pressure, odds of a margin call grow. This probably played a role in March this year. The momentum names were handed out a nice shellacking that month. The likes of bio-techs and ‘social’ dropped 25 percent in no time at all. Even the Nasdaq and small-caps dropped some 10 percent in a month and a half.
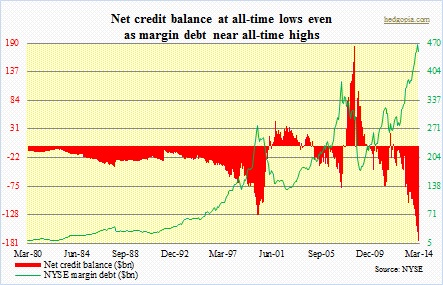 Ultimately, this process can set in motion a self-fulfilling prophecy. Stocks drop, margin calls ensue, which then causes more selling. This is important considering the accompanying chart, which is simply another way to show how extended things are. When the NYSE publishes this series, it provides three different data points – ‘debit balances in margin accounts’ (amounts borrowed by customers to purchase securities in margin accounts), ‘free credit cash accounts’ (cash balances) and ‘credit balances in margin accounts’. To arrive at the net credit balance, the latter two are added and subtracted from the former. When it is all said and done, the unwinding of all this will not be pleasant.
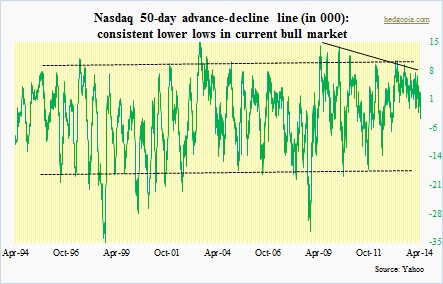
Markets overall look very top-heavy right now. And while the SPX and the Dow have recovered recent losses, techs continue to lag. Money that came out of former stalwarts such as bio-techs is staying out. The chart below shows how narrow the breadth has been on the Naz. Having said all that, the selling that took place in former momo names has not yet gotten contagious. If I have to guess, it is coming. For now, sellers are on strike, and the presence of heavy short interest probably forces shorts to lock in gains quickly, as I did. Covered my shorts yesterday AM. Home runs are hard to come by in this yo-yo market.