
- Margin debt continues to hover near all-time highs, with some subtle differences underneath
- Fourteen-percent rise in SPX since Feb unable to inspire more leverage-taking
- Naz correlation suggests margin debt headed lower in outer months
In today’s algo- and dark pool-dominated markets, NYSE margin debt probably is not as good a signal as in the past. Nevertheless, it does offer a window into prevailing sentiment. And it continues to be that of complacency. Debt stood at $463.9bn in September, barely off the all-time high of $465.7bn in February this year. Even though leverage remains at elevated levels, some under-the-surface subtle changes are noticeable. Since that February peak, margin debt did drop to $437.2bn in April; the S&P 500 Large Cap Index suffered a one-week, four-percent-plus drop that month. Between March and April, debt shrunk by $13bn. In July/August, we had another two-week, four-percent-plus drop on SPX, during which margin debt essentially stayed flat, but net credit balance deteriorated by about $8bn. 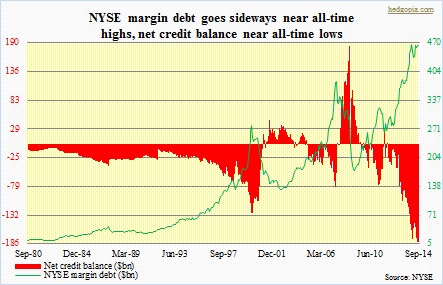
Since June – that is, for four months now – margin debt has only gone sideways, even as stocks in general are higher. Market participants seem increasingly hesitant to add to leverage. A whole host of things could be playing a role here – ranging from impending end of QE to an ever-aging bull market in its sixth year to deflationary signals coming out of commodities and bond markets to ex-U.S. macro data showing deceleration. Particularly since the early-February low of 1752, SPX is up nearly 14 percent. Margin debt has not followed suit. This is a difference worth taking note of. 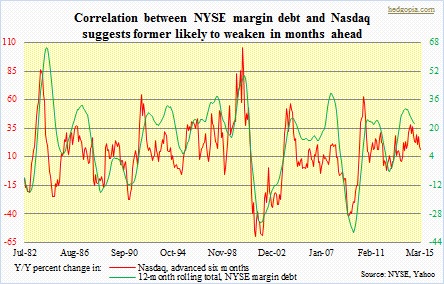
The September data obviously does not capture the roller-coaster ride equities experienced this month. The intra-day high on SPX on September 30th was 1985, followed by an intra-day low of 1821 on October 15th; yesterday closed at 1995. A complete round-trip, and then some. The question is, were there margin calls along the way? Is that what led to a sharper decline in the first half of the month? Question is pertinent, as net credit balance remains very low – -$177bn, versus August’s all-time low of -$183.1bn. Amidst a sell-off, if debtors lack cushion to fall back on – in this case, net credit, or a lack thereof – they will sell in order to meet the margin calls. In the five sessions ended October 15th, SPX dove 7.5 percent. Such sharp, panicky drops can easily set off margin calls. We will find out when numbers for October are reported in a month. This will also give us a sense of investor appetite for risk-on as to if the second-half (October) surge in stocks inspired more leverage-taking.
Be that as it may, the second chart above continues to suggest lower margin debt in the outer months.
