
Margin debt in March surged to an all-time high of $476.4 billion.
Earlier, it had gone sideways for a year – from $465.7 billion in February 2014 to $464.9 billion in February 2015.
With the March spike, a signal that flashed yellow in January is now negated.
Margin debt remains elevated, no question about it. But the level alone cannot be used as a signal. An already high level can still move higher, as just happened last month. Having gone sideways for a year, it was beginning to look like margin debt was plateauing. Except it was not.
One of the ways we can use it as a long-term signal to get cautious on equities is when margin debt crosses down through its 12-month average. That occurred this past January (margin debt of $444.8 billion versus its 12-month average of $454.6 billion). In March, the red line in the chart below hooked back up after a brief dip below the green line.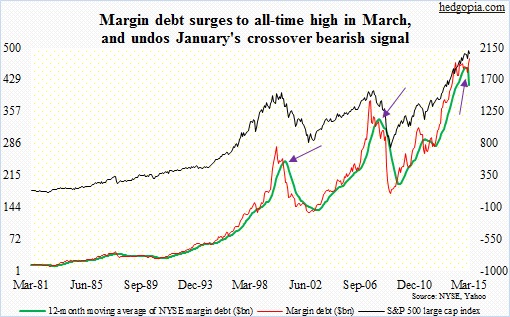
In the chart, the two other arrows point to when this crossover occurred in 2000 and 2008.
In 2000, margin debt went under the 12-month average in October; the S&P 500 large cap index stood at 1429 then. On an intra-day basis, the index peaked in March that year at 1553, but on a closing basis in August (1518).
In December 2007, margin debt went under the 12-month average with the S&P 500 at 1468. The index peaked intra-day at 1576 in October that year.
Those were pretty good signals, but there have been false ones as well.
For instance in 2011, there was a crossover in August, which lasted for seven months. Then in 2012, there was one in May and July each. But they did not persist long enough to cause a lasting damage to stocks.
Time will tell if January’s false signal was like the ones in 2011 and 2012, or the March spike in margin debt was the last hurrah!
For now, there is no crossover signal.
Thanks for taking the time to read this post!
